Almost half of U.S. households own mutual funds either through their workplace retirement plan or in personal portfolios. But with thousands of funds available, how do financial advisors research and track funds for clients?
FundVisualizer offers a solution — a free, powerful mutual fund comparison tool created just for advisors. FundVisualizer enables advisors to compare mutual funds in every asset class and investment category simply and quickly.
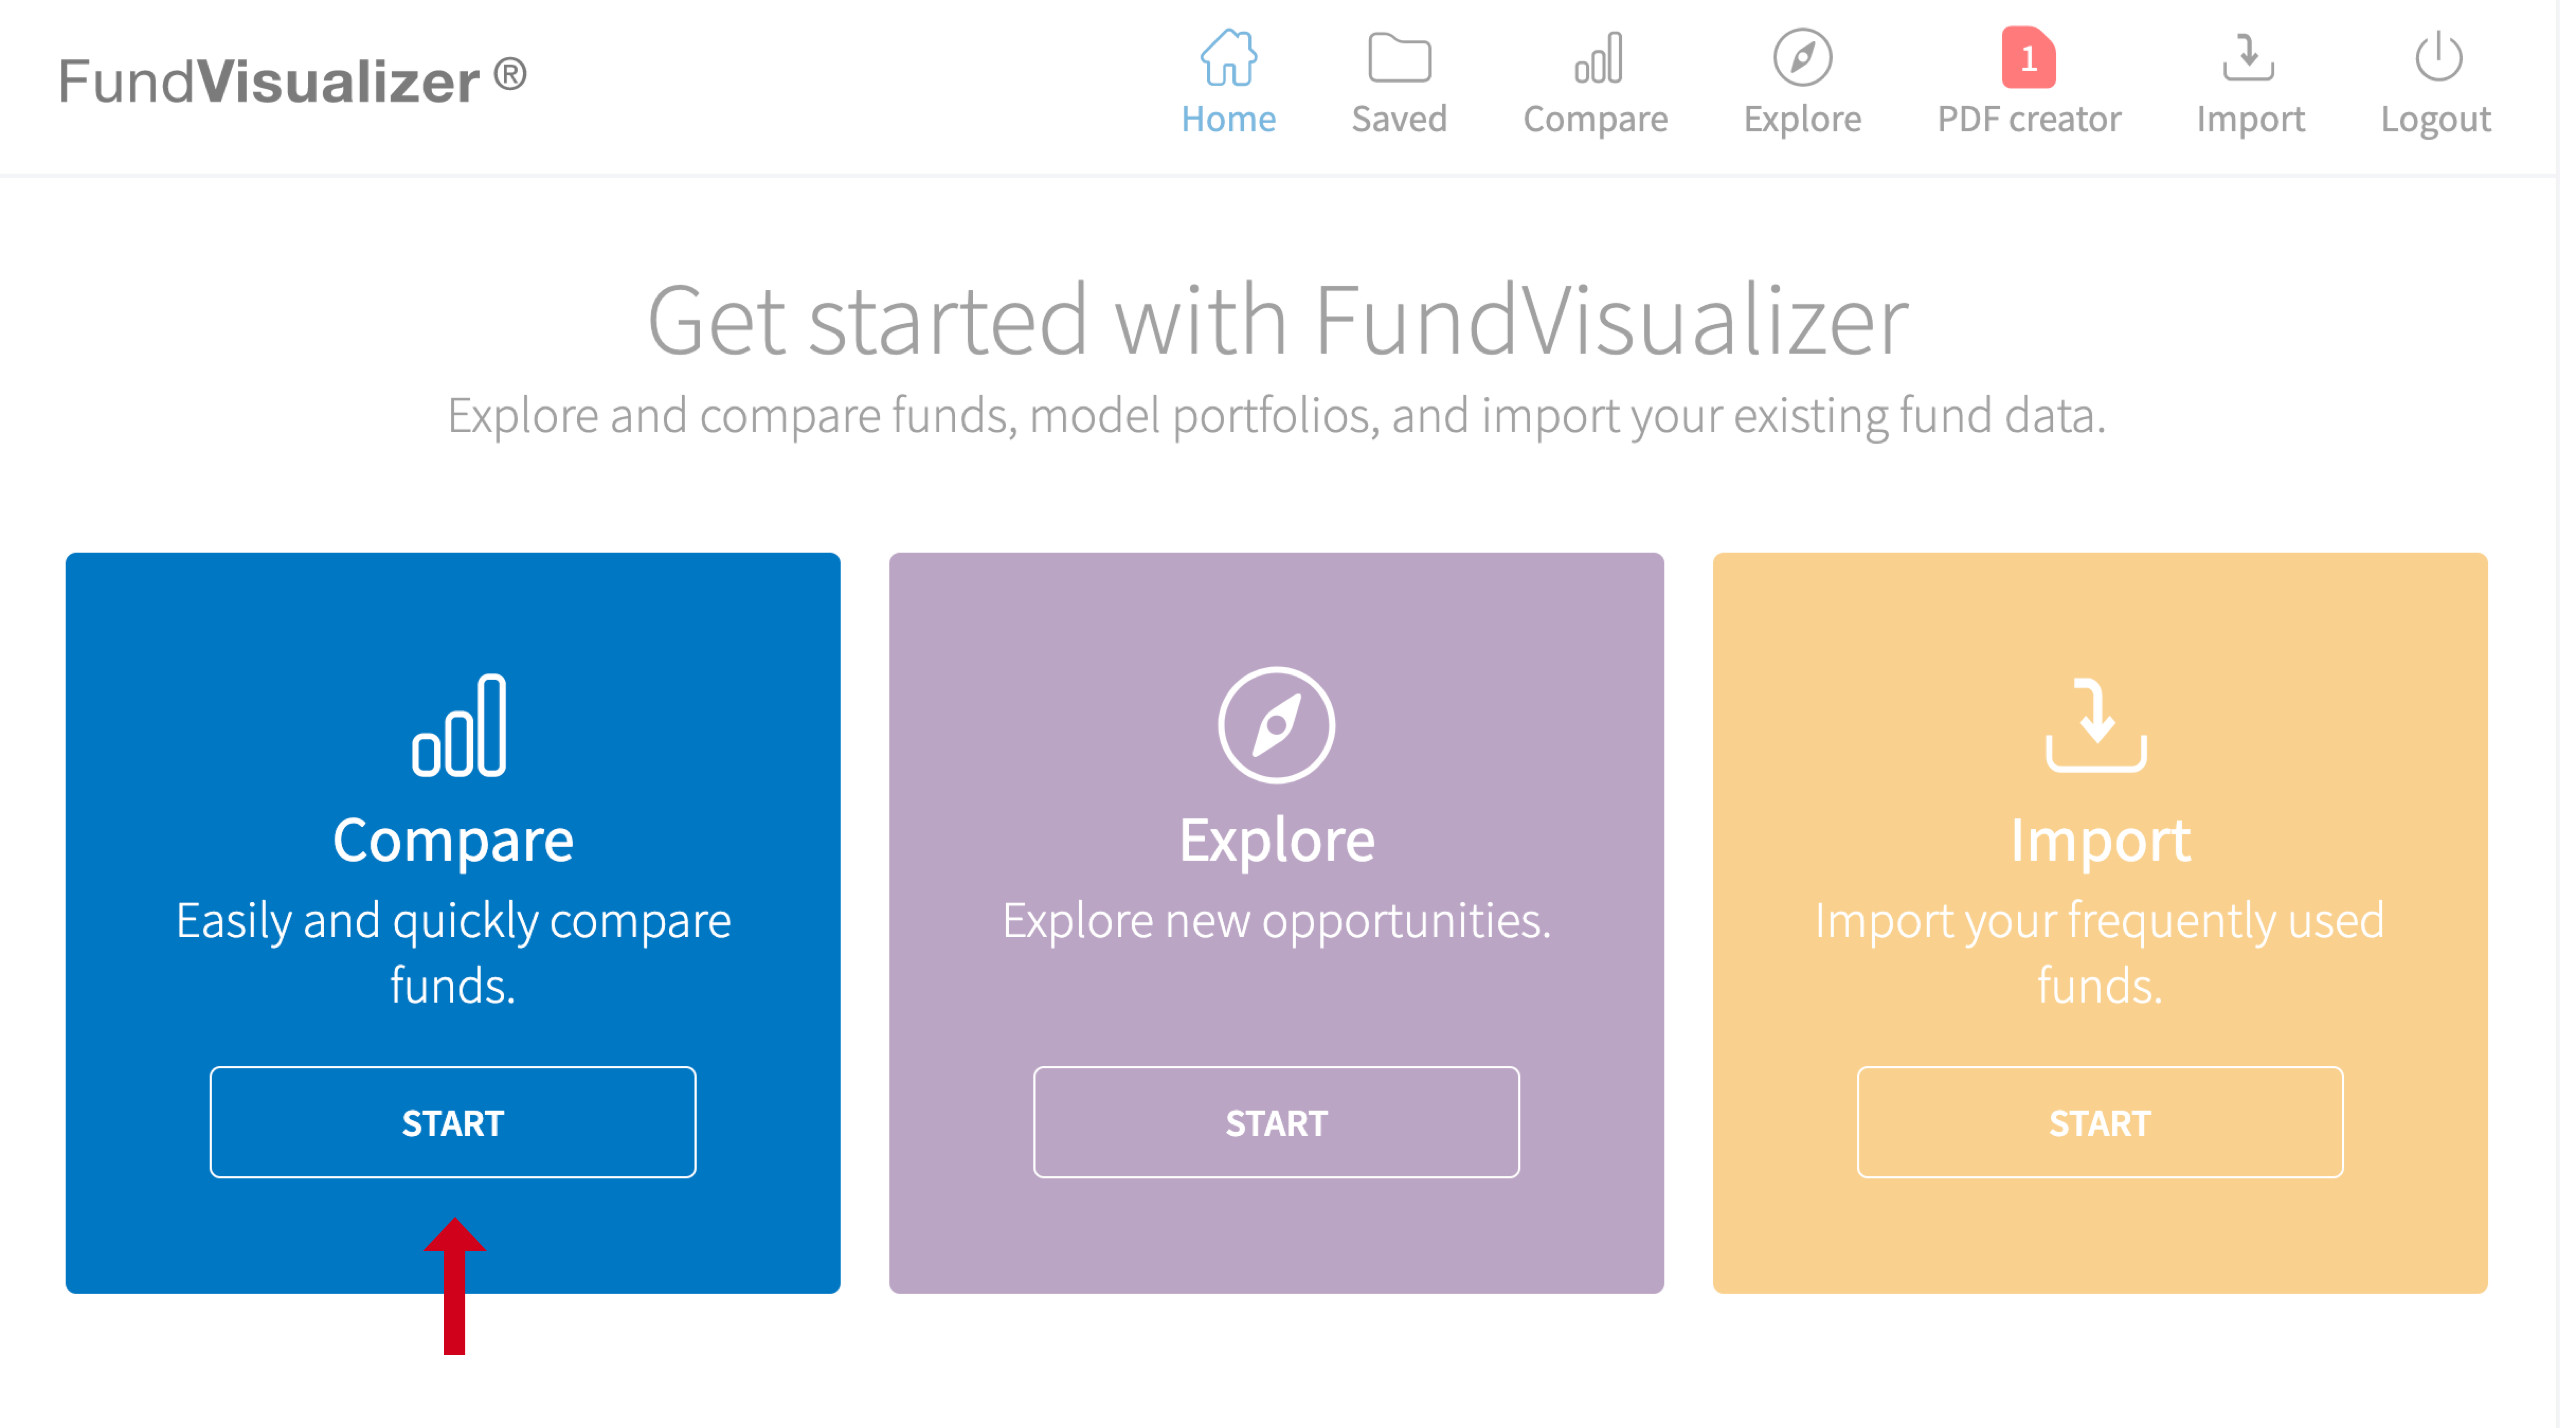
Start with a single fund
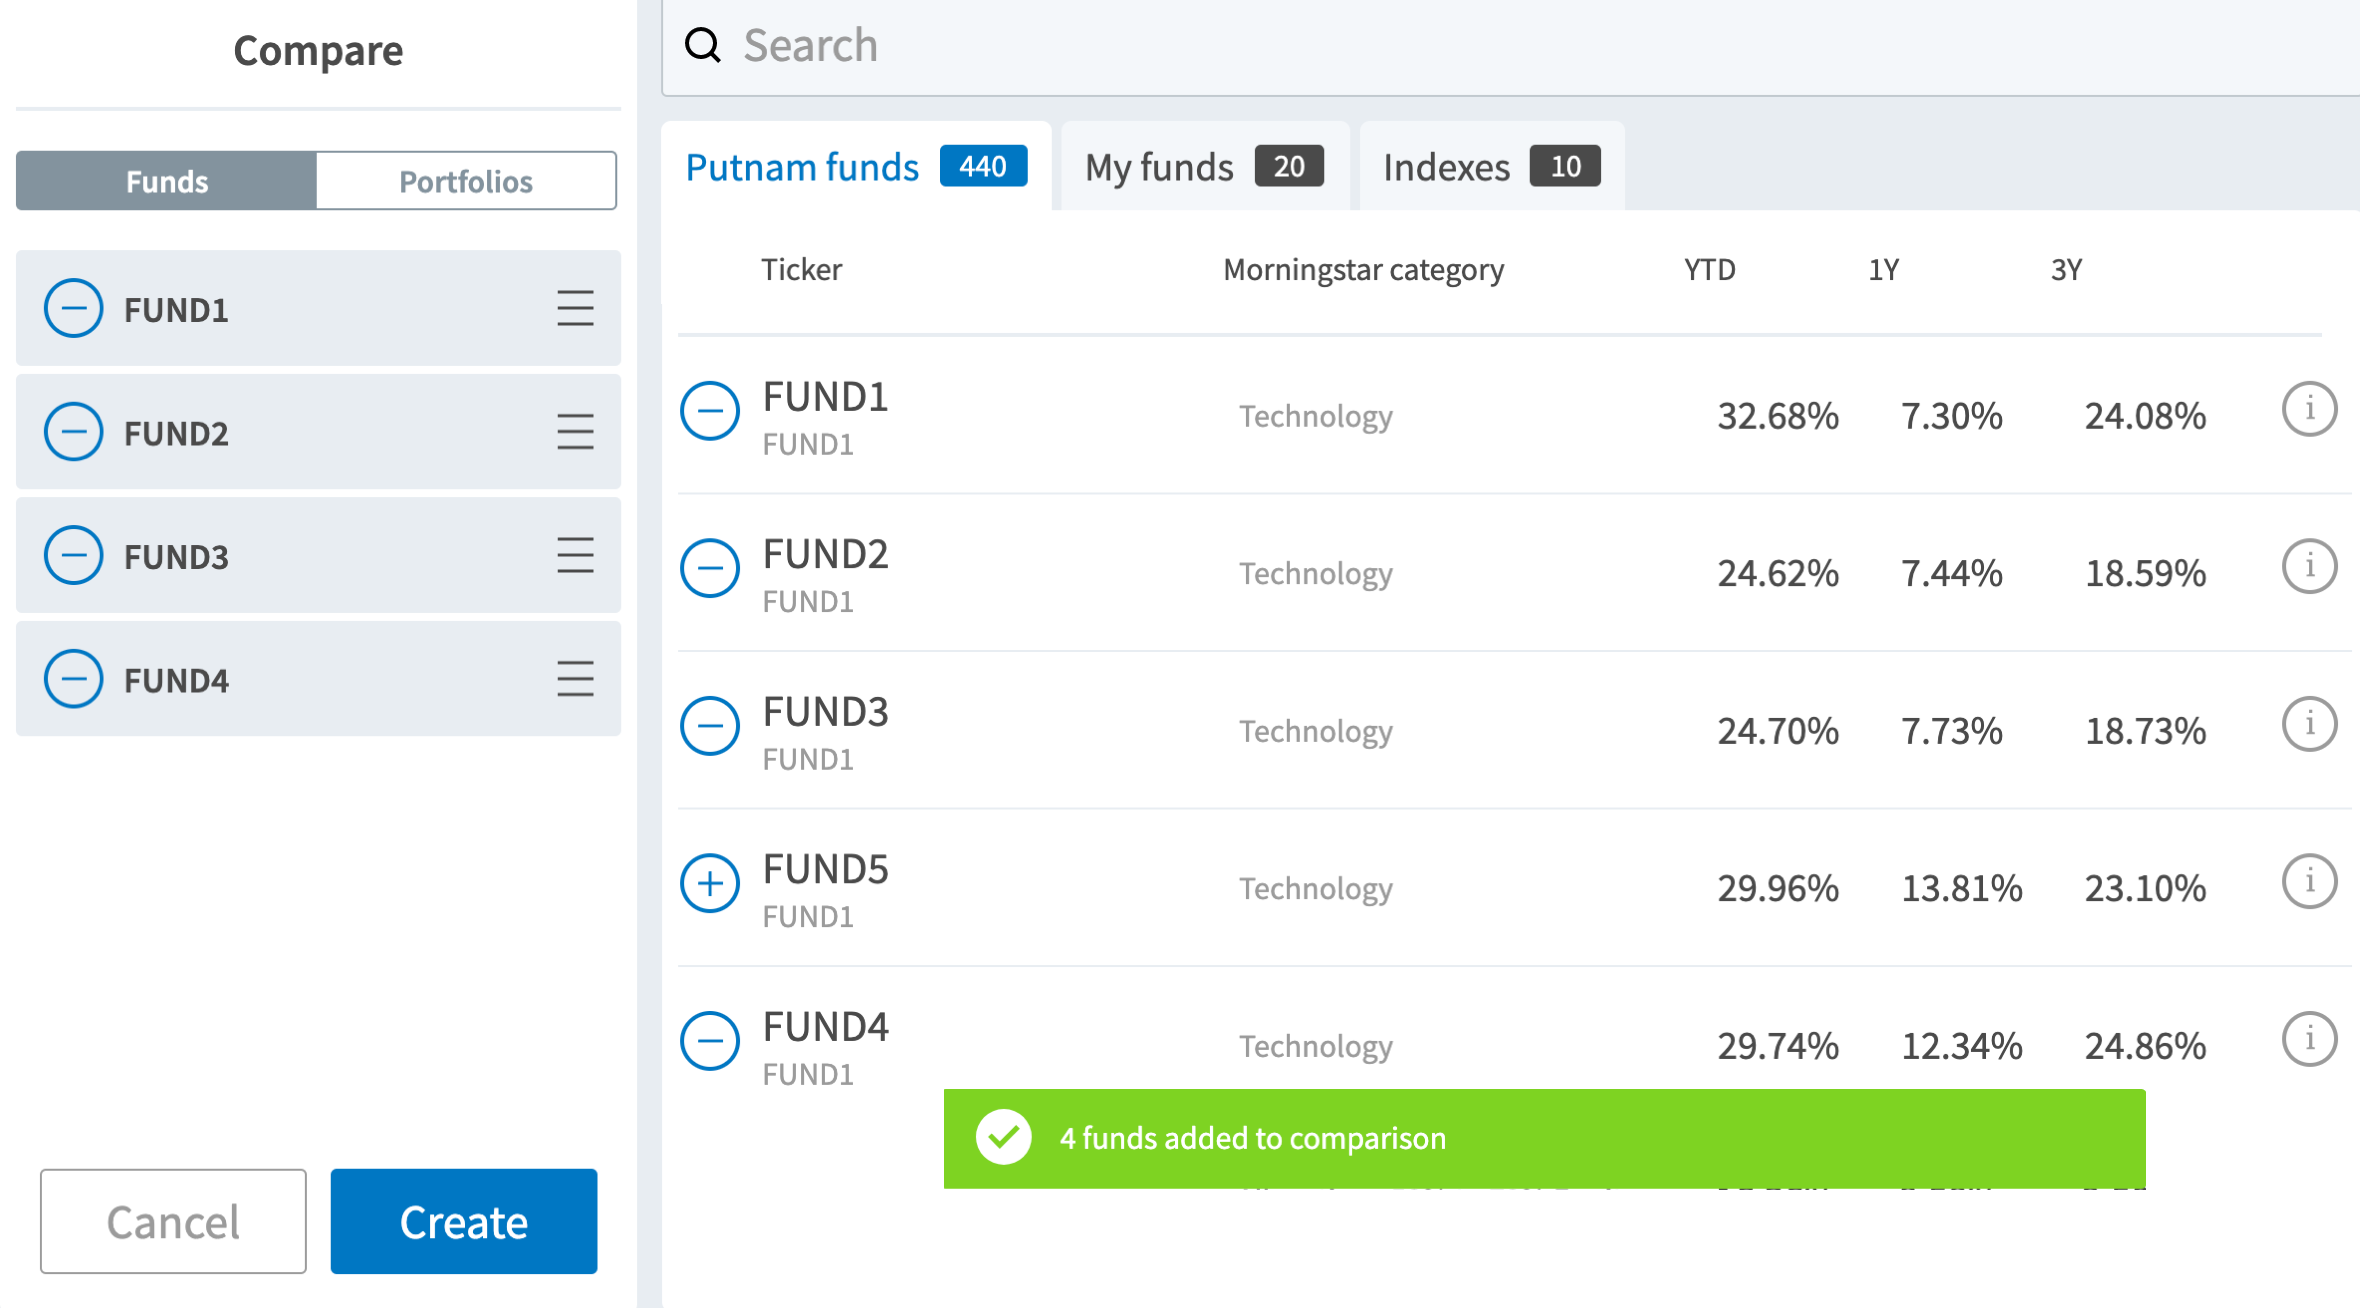
Launch comparisons selecting Compare.
Type fund tickers or names to create a comparison group. Click the + button to add a fund to the comparison.
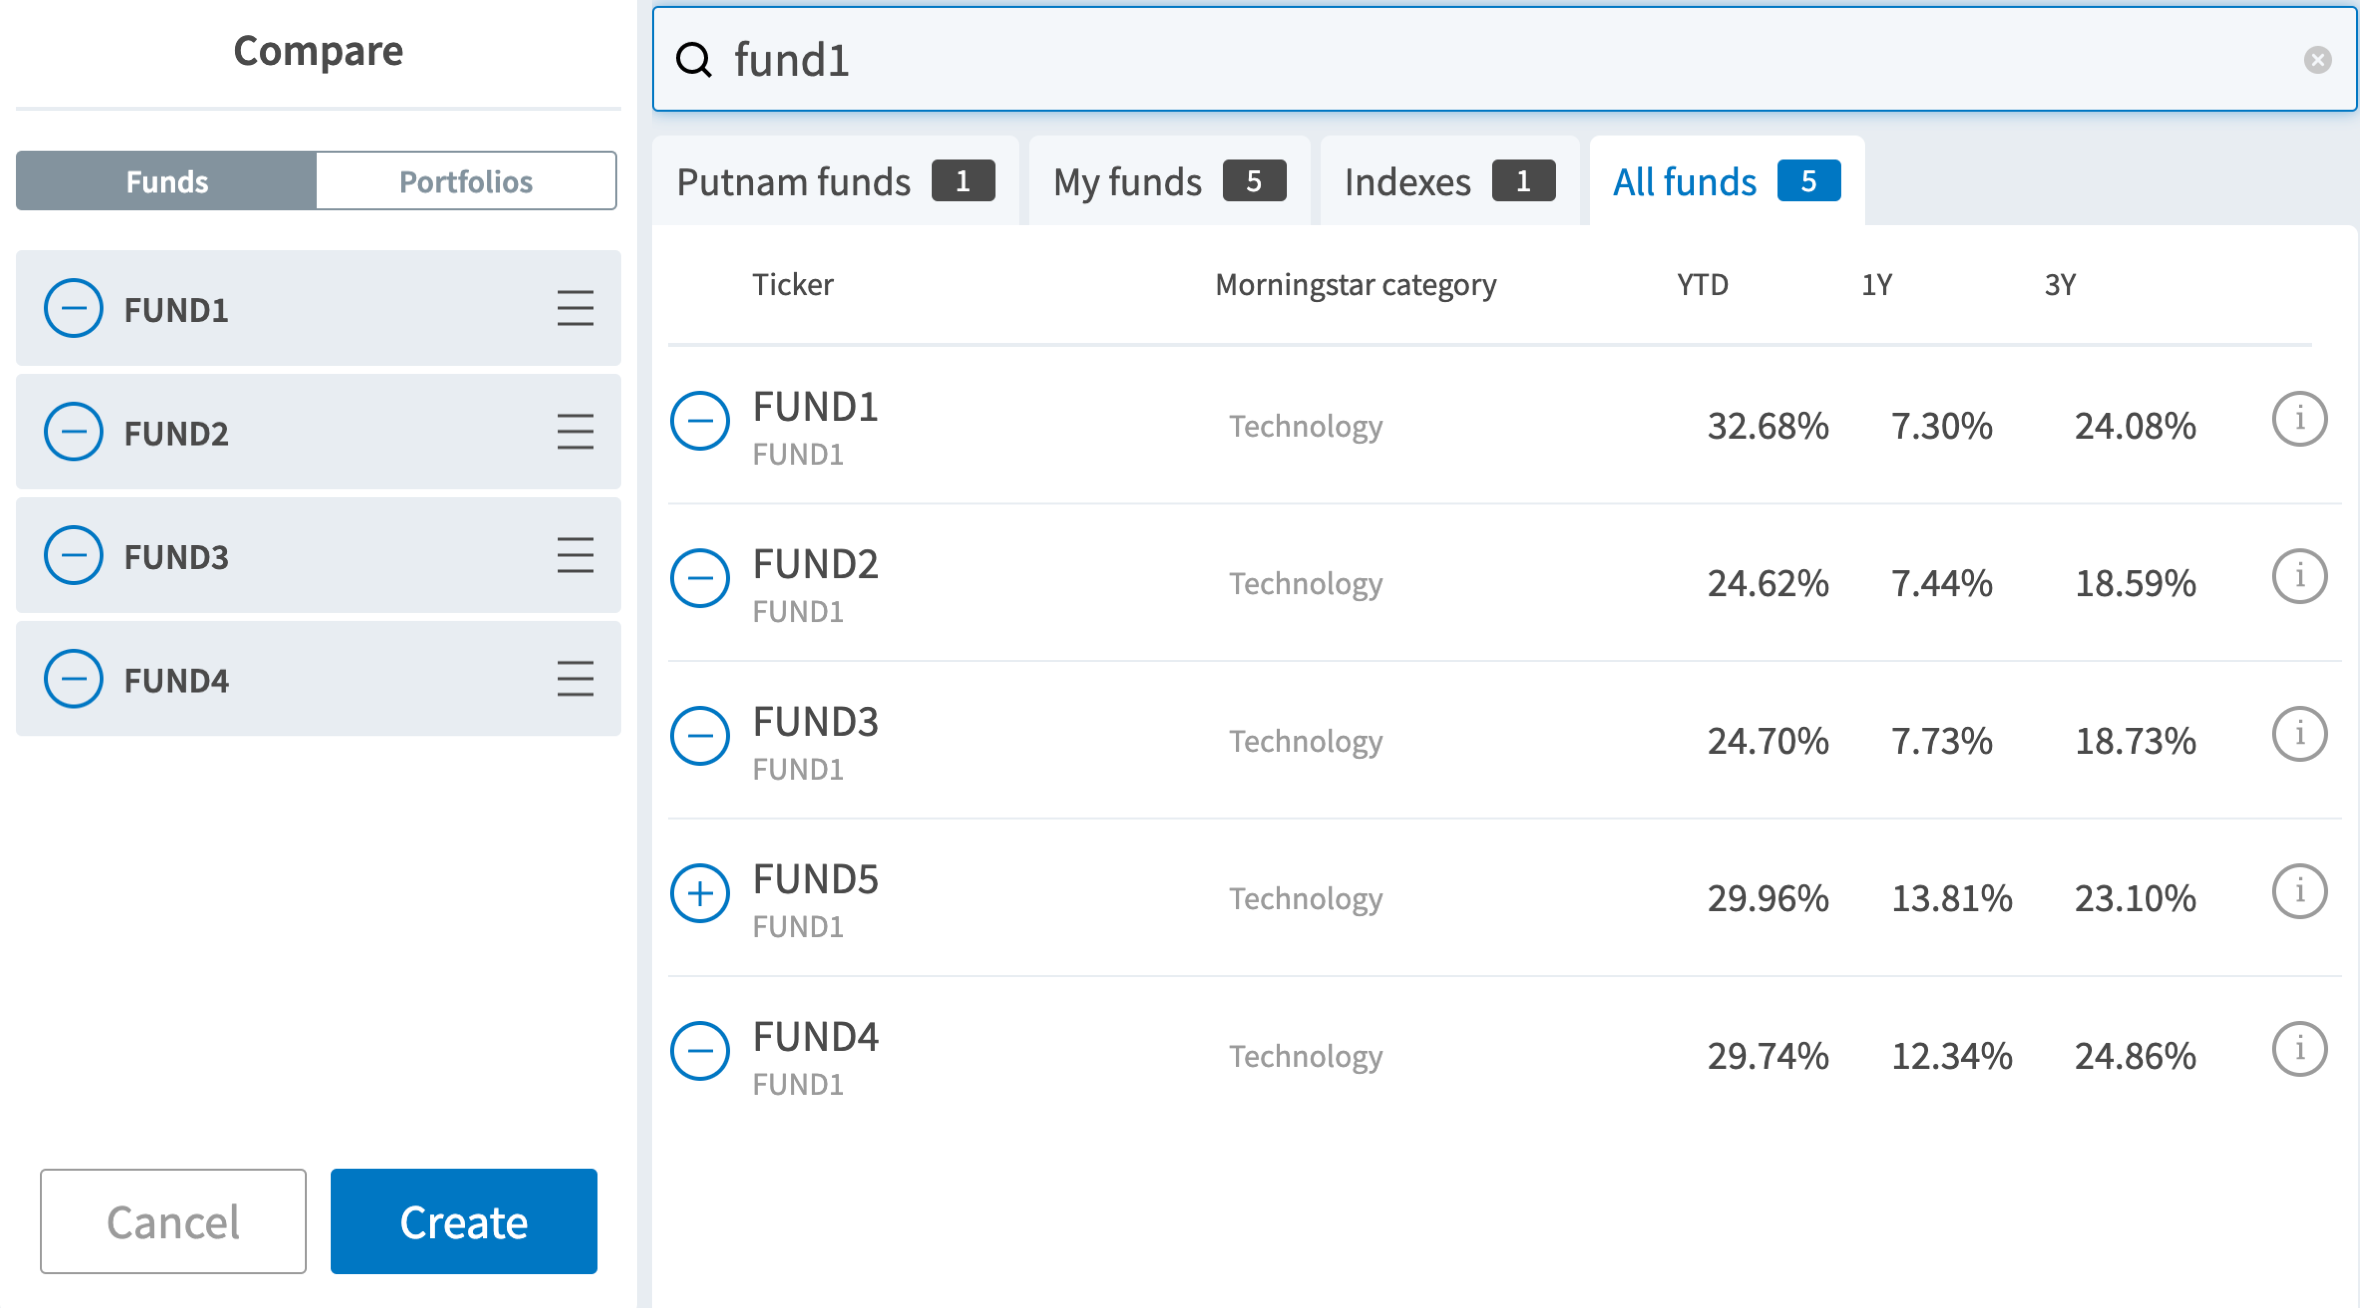
Compare funds across more than 80 different performance and risk metrics. Build interactive charts, create PDFs for clients, and save all your research to use later.
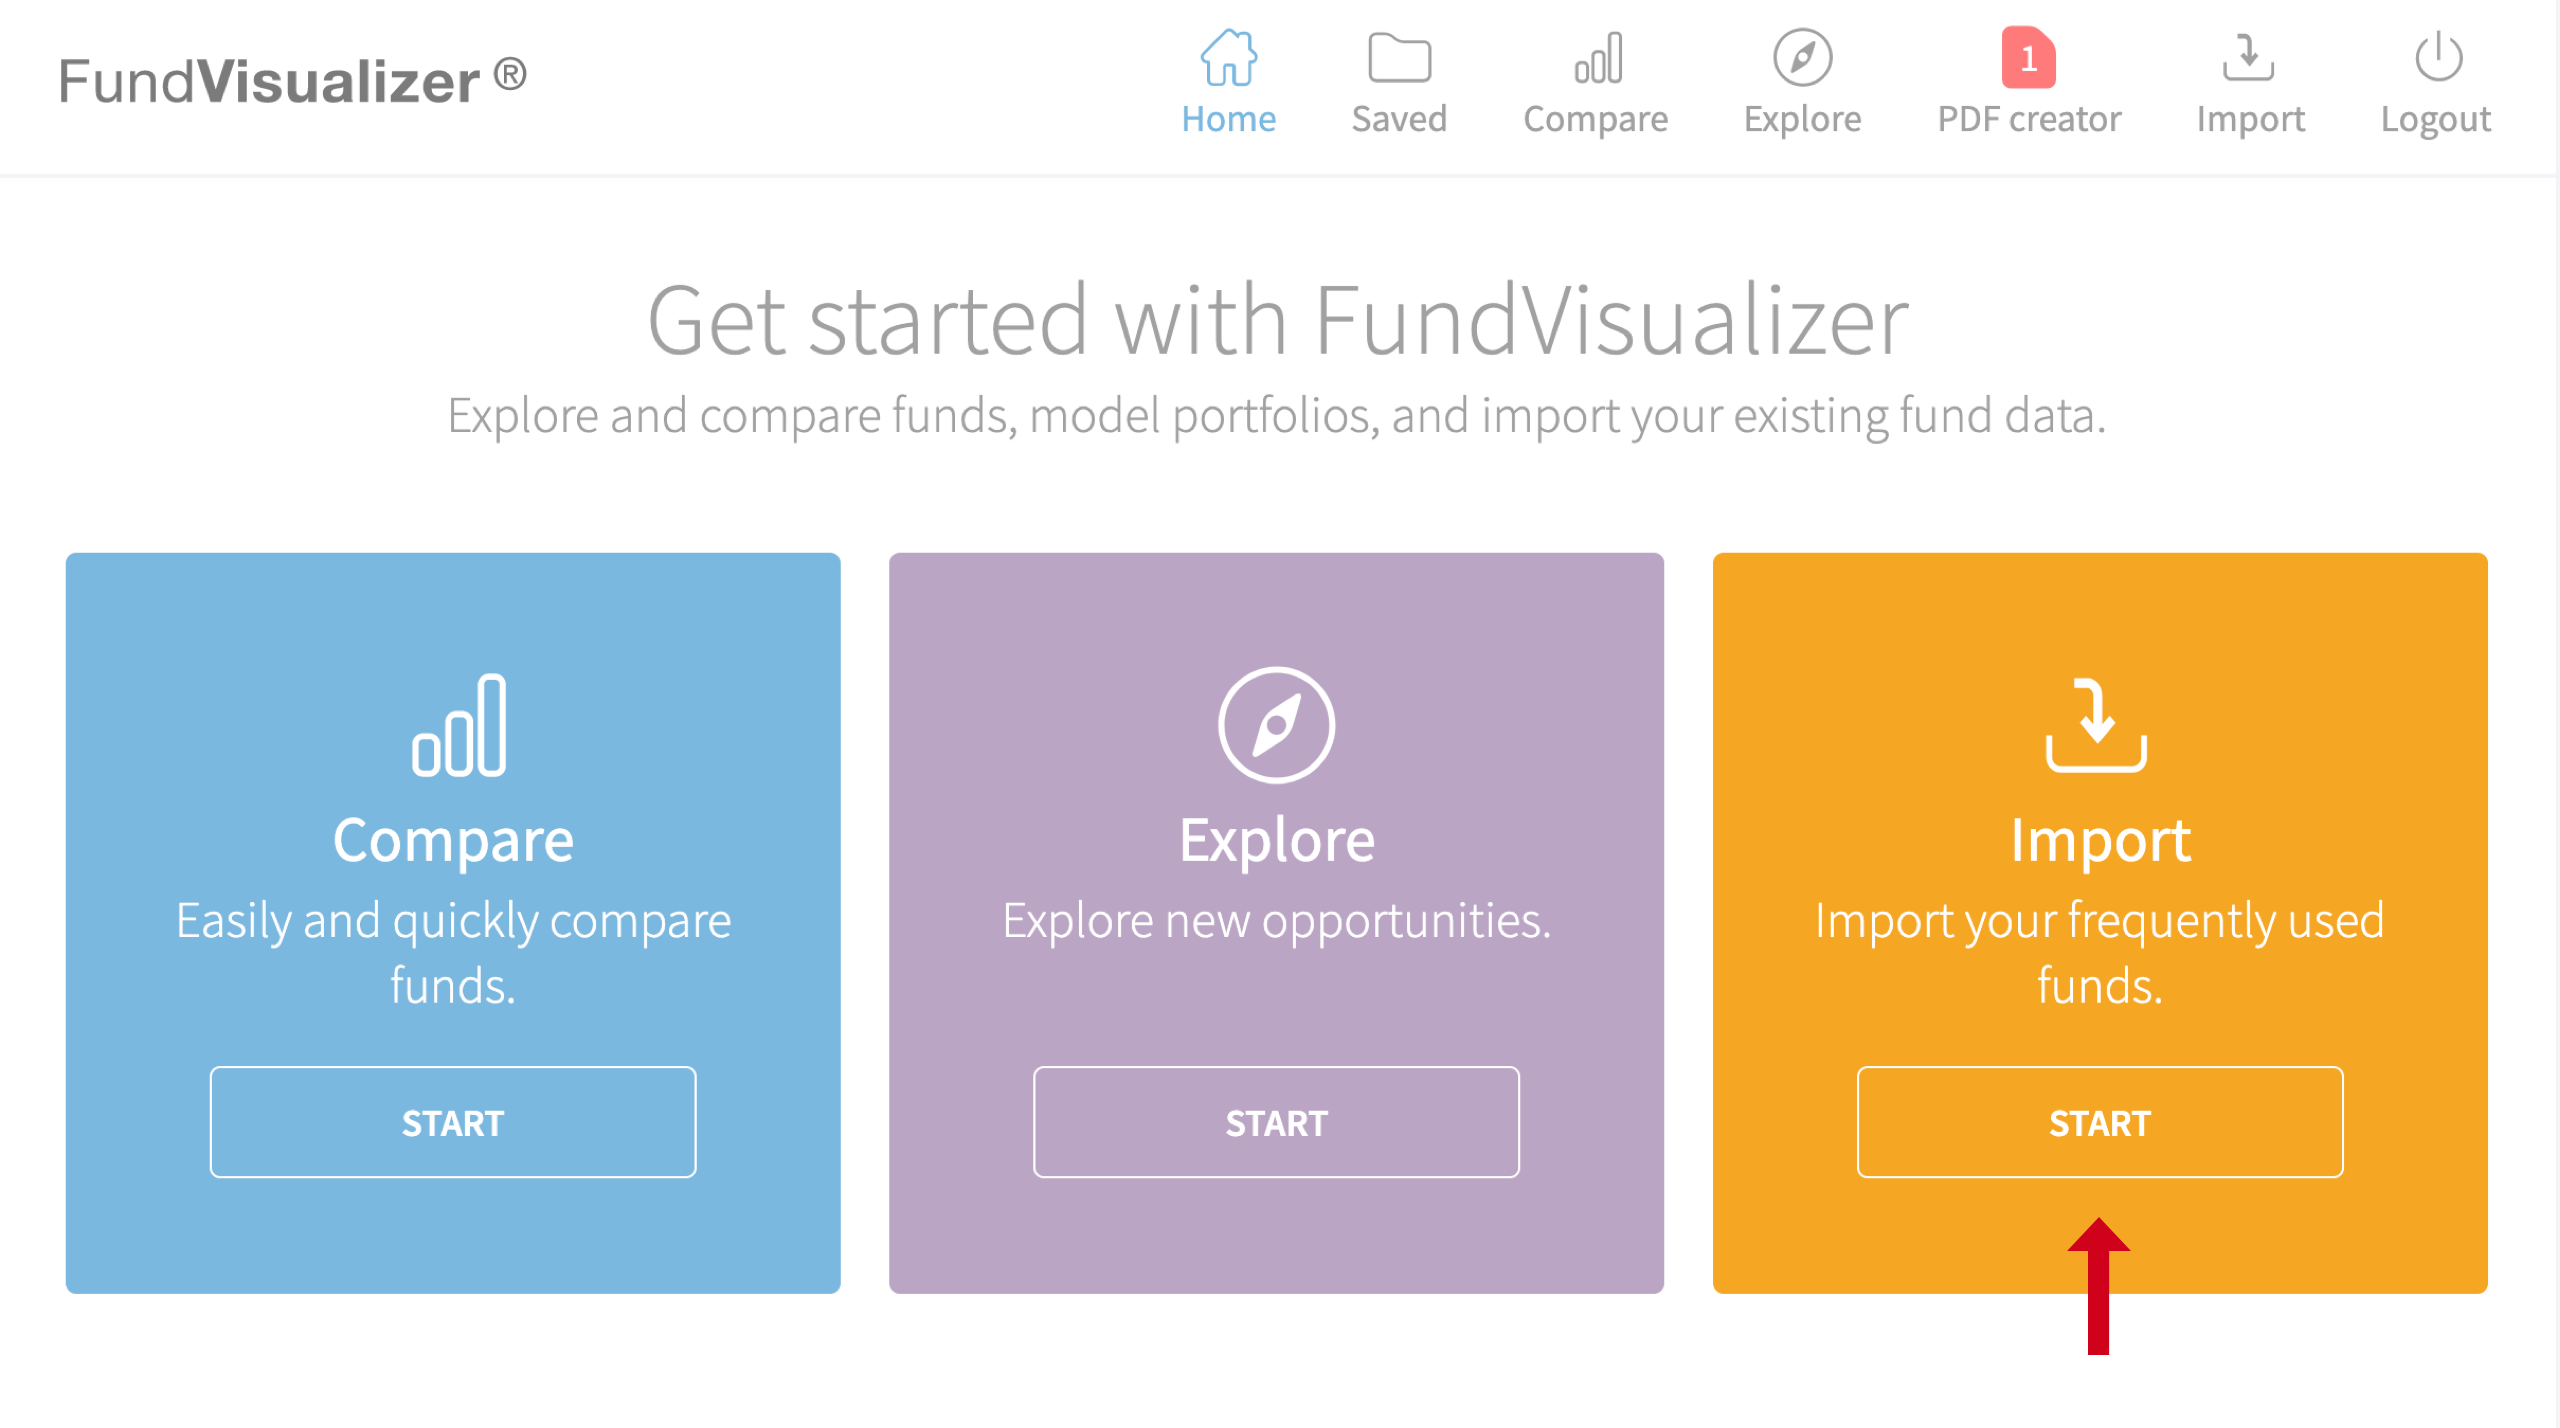
Upload a list of key funds or a portfolio
To upload a list of the mutual funds you currently recommend to your clients, select Import.
Either copy and paste from a spreadsheet or upload a whole file at once.
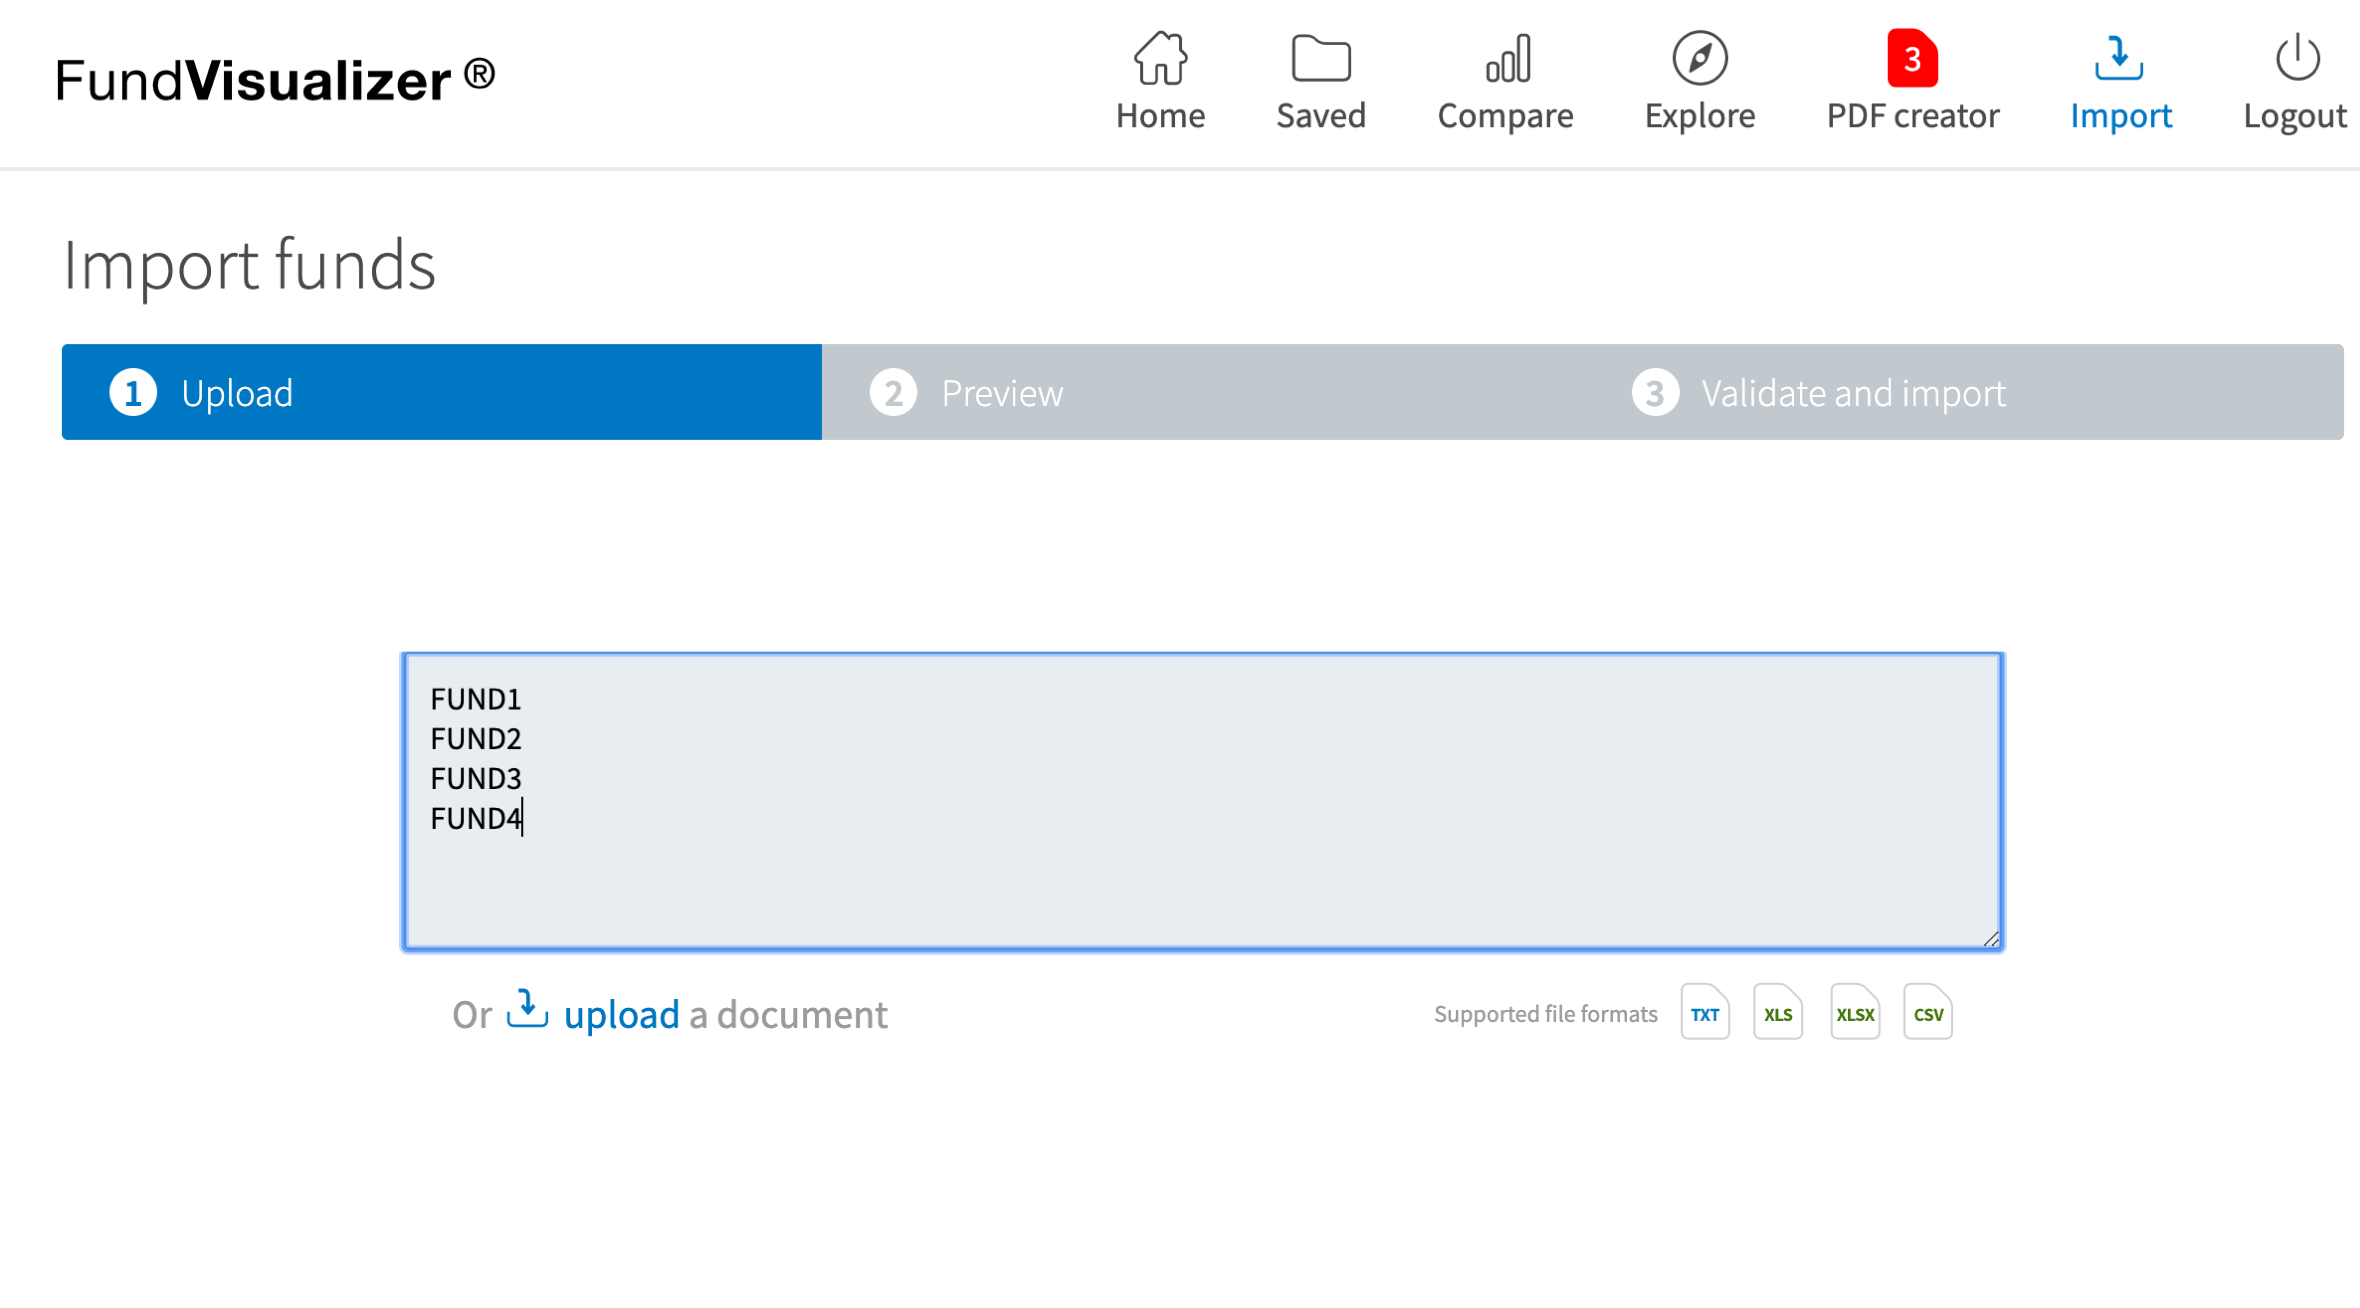
Preview and check the list to be sure the names and tickers are entered correctly. Click Create to compare your funds, ETFs, and indexes.
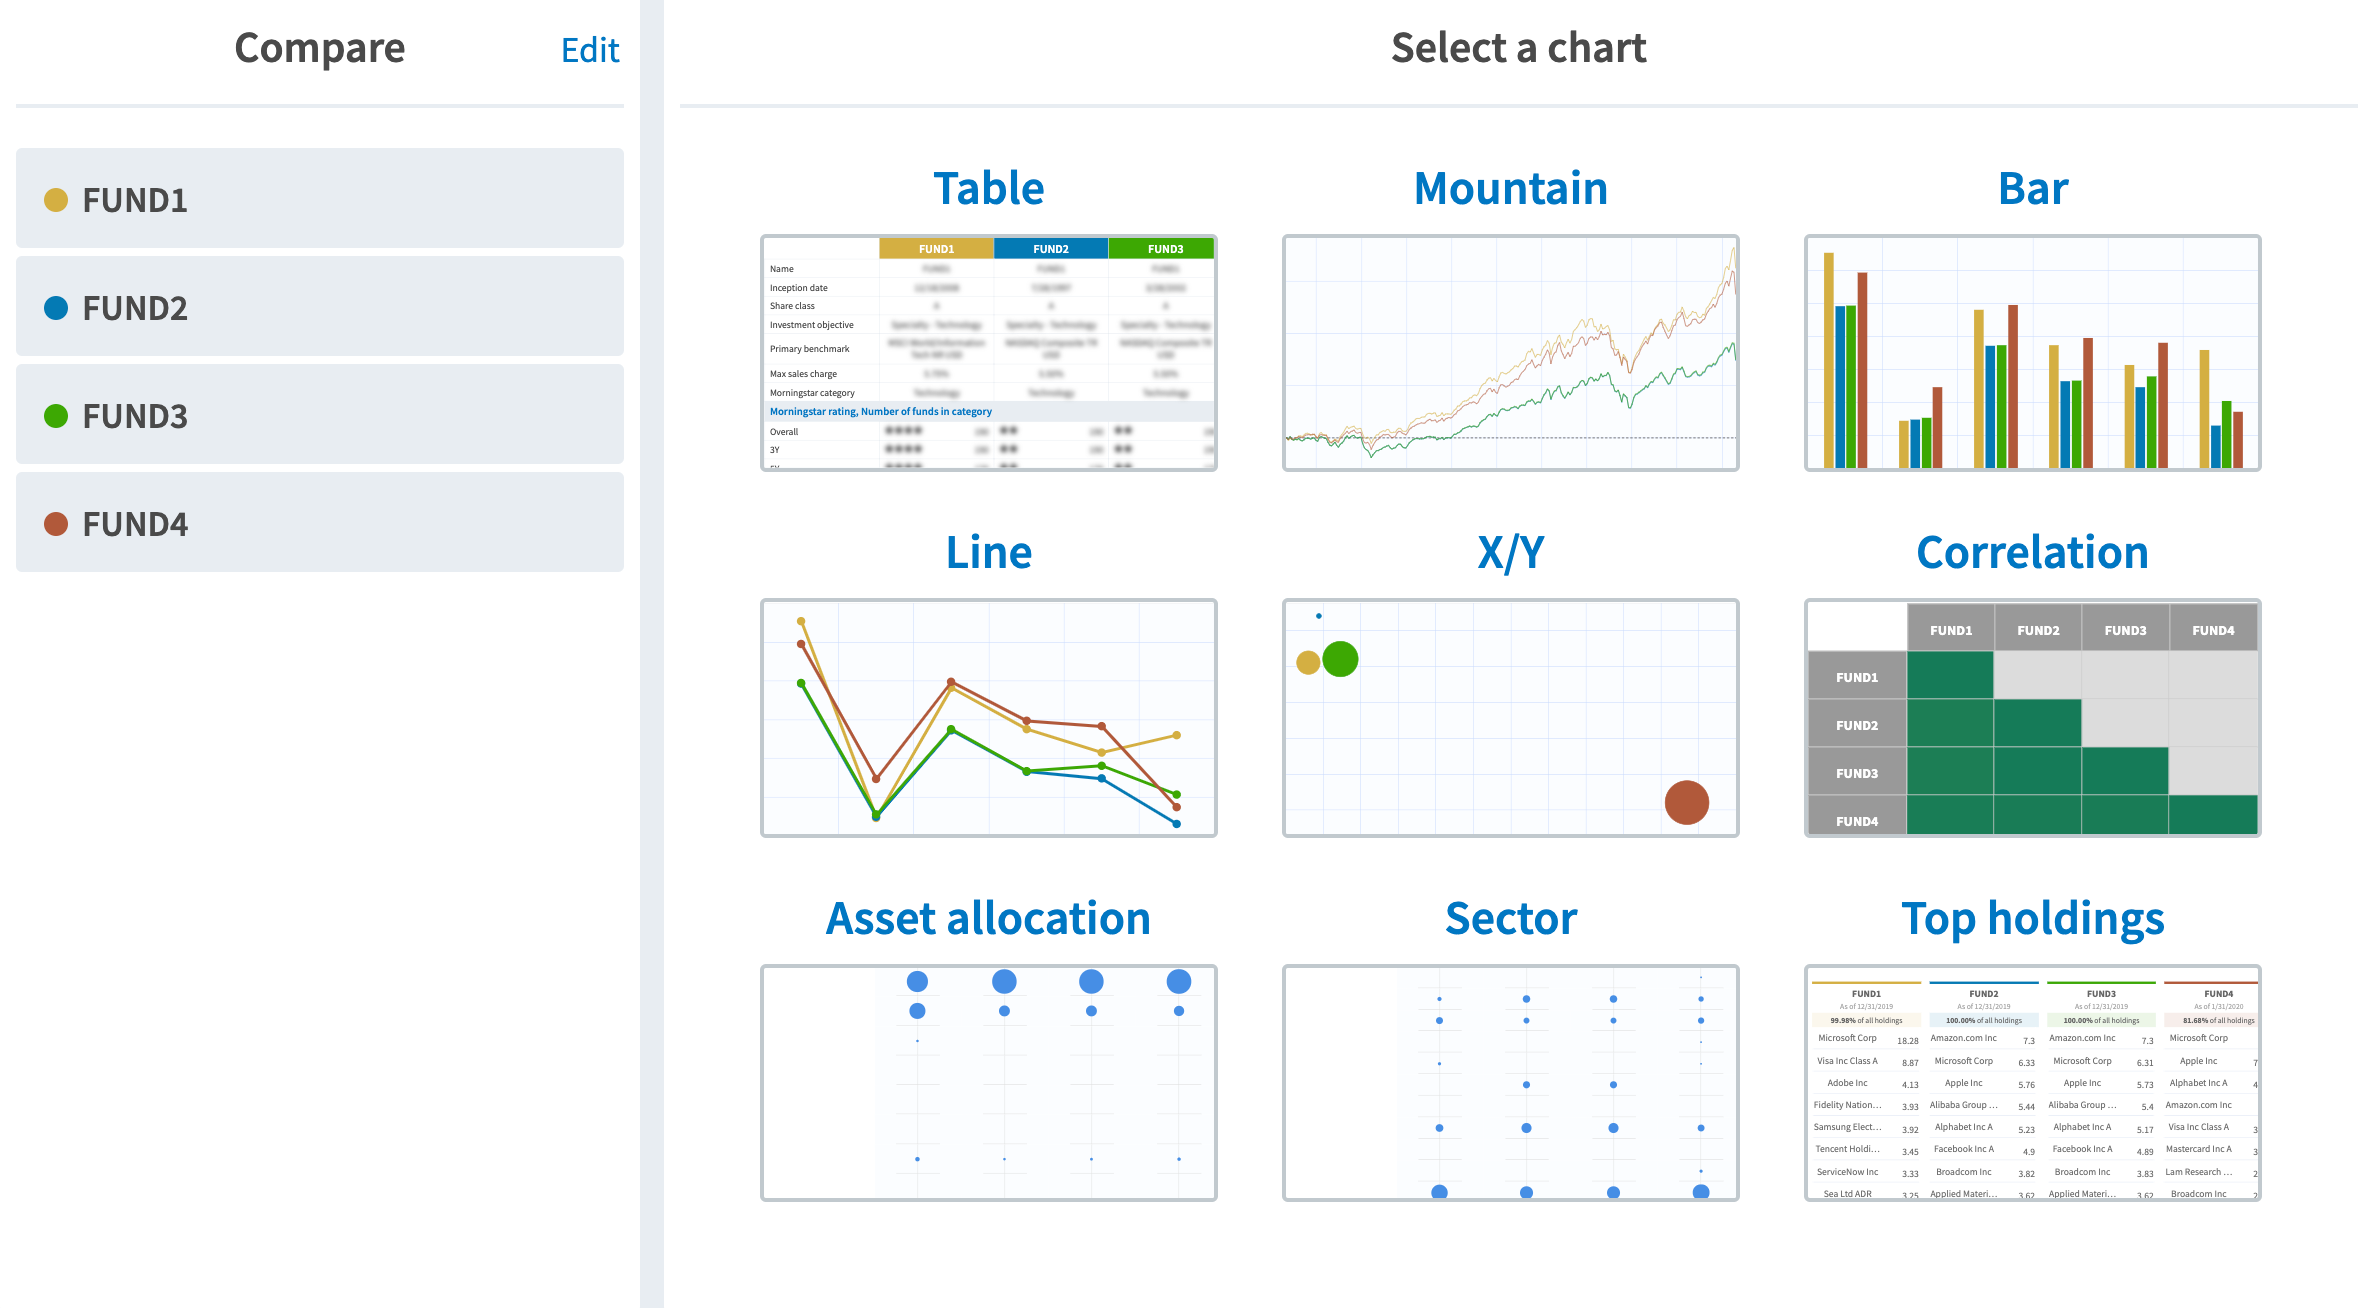
Compare the funds in your group using data tables and a variety of graphs. The results may be revealing.
Dive deeper
Compare performance and risk metrics of funds over 1-, 3-, and 5-year periods. See below for how fund Sharpe ratios, a common metric for understanding risk, have varied or remained consistent over time.
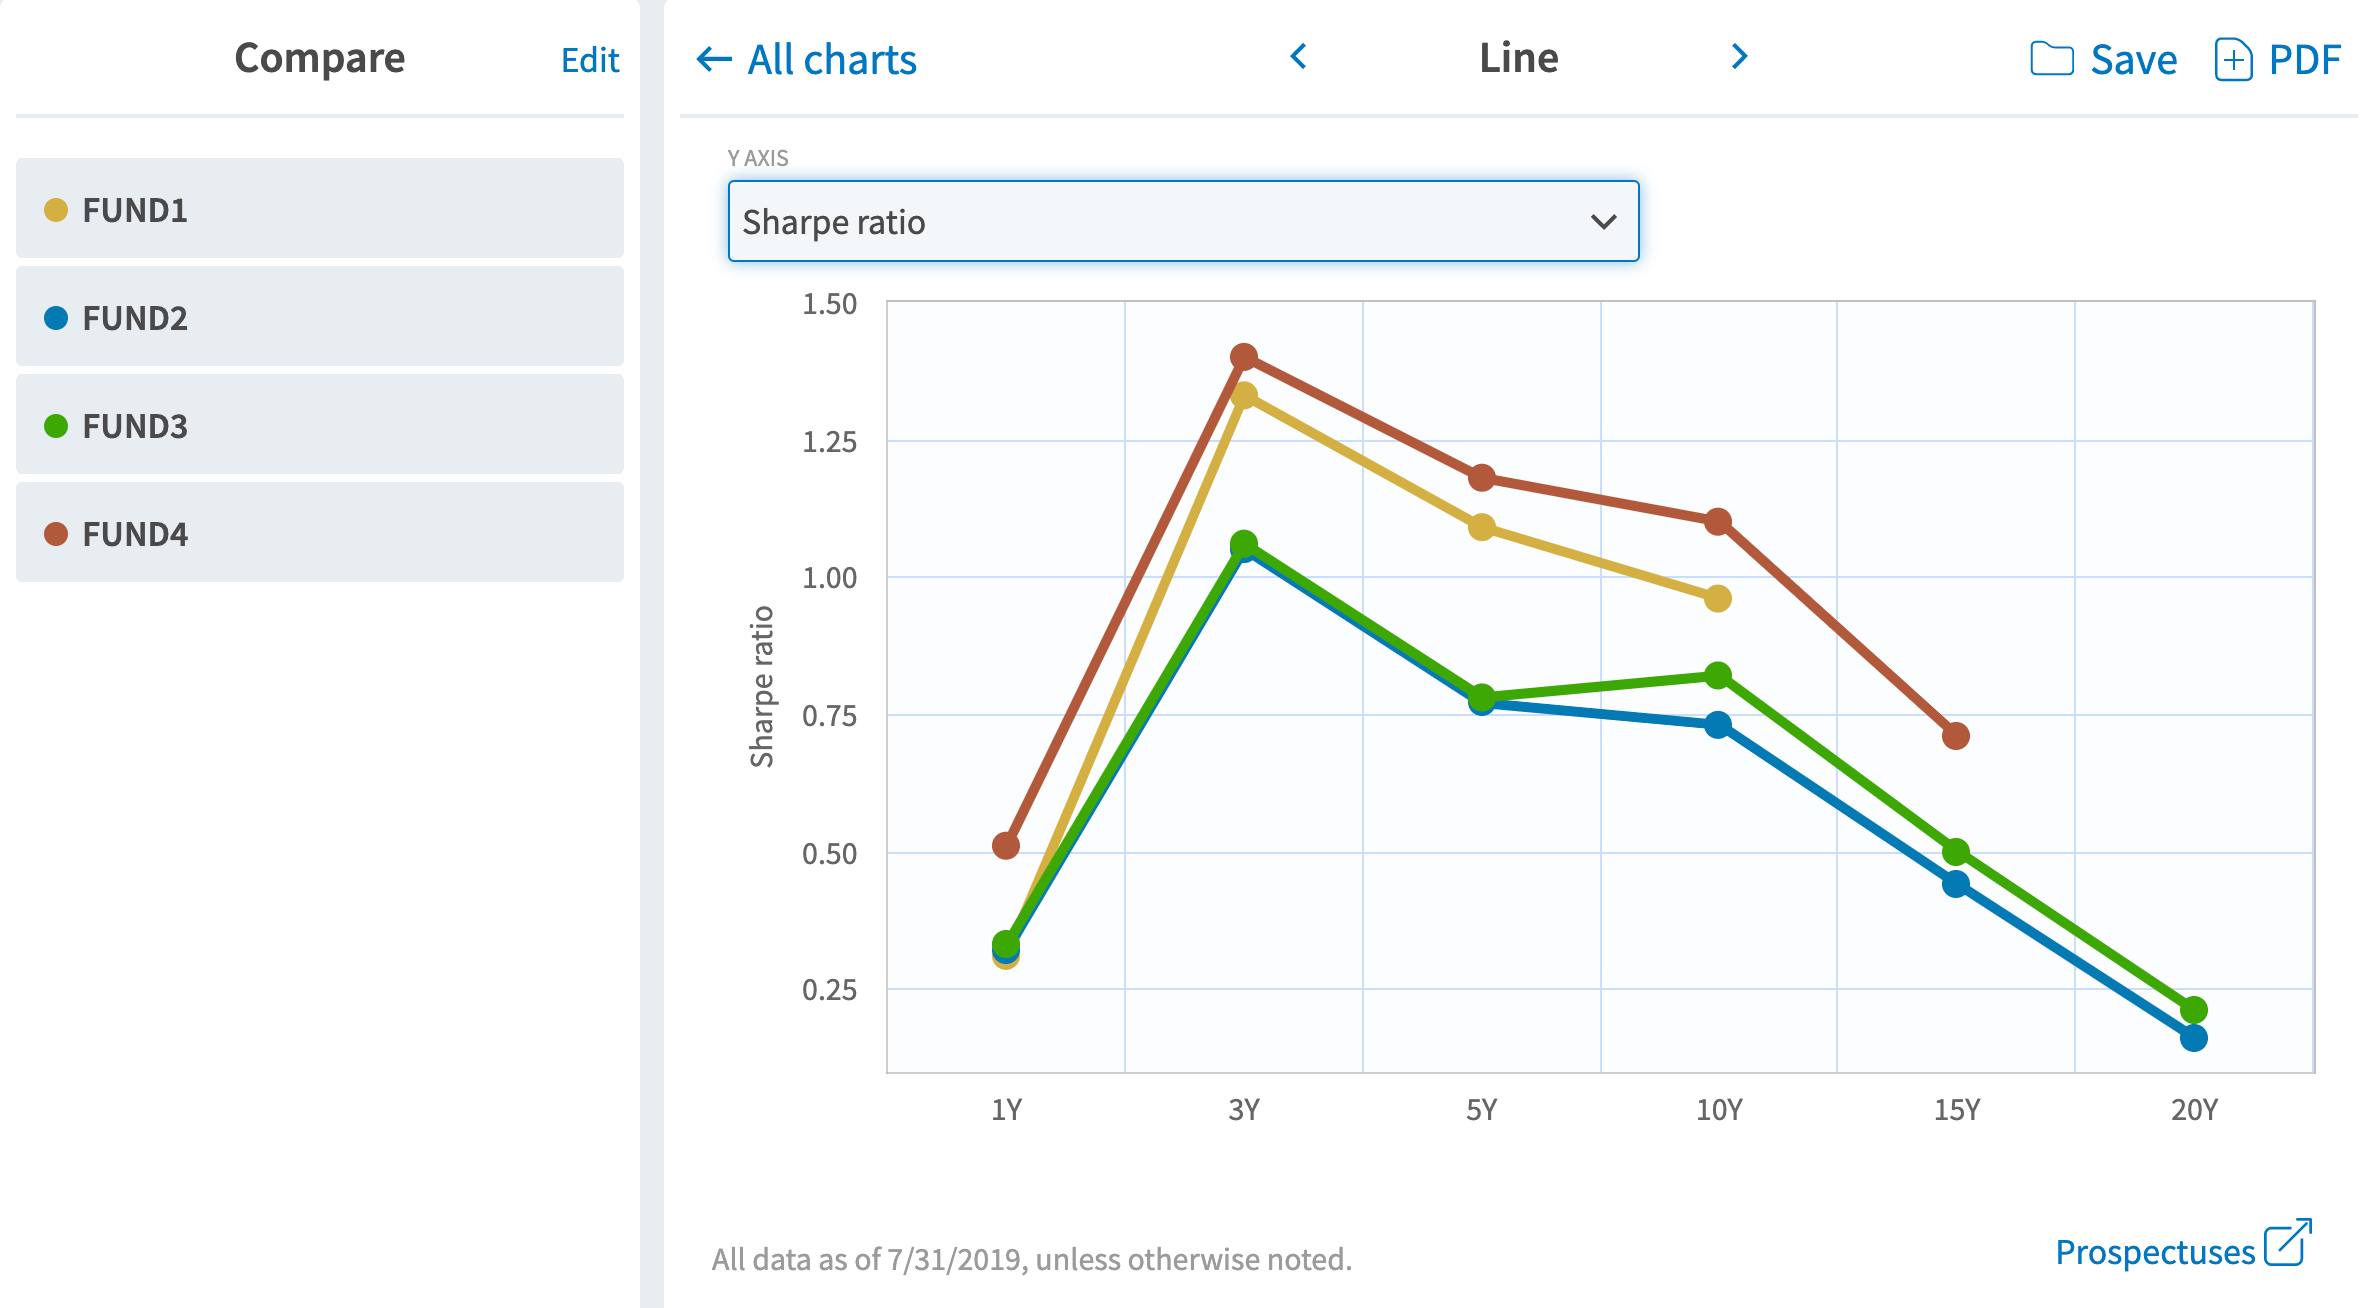
You might detect how certain investment styles or portfolio tilts perform better in some markets over others.
Use this mutual fund comparison tool to reach key, unique research insights that your clients will appreciate.