As a financial advisor, you know that clients today don’t simply want a star fund or fund manager. Clients look to financial advisors to provide better risk-adjusted performance that helps them achieve long-term goals.
FundVisualizer enables you to explore funds and to create portfolios that demonstrate how you are helping clients achieve their goals.
Create a portfolio of funds
To create a portfolio of funds and ETFs, click Compare and begin entering funds by name or ticker. Click + to add a fund, ETF, or index to your portfolio.
Once you’ve created your portfolio, FundVisualizer offers a choice of interactive charts that enable you to analyze funds that make up the portfolio.
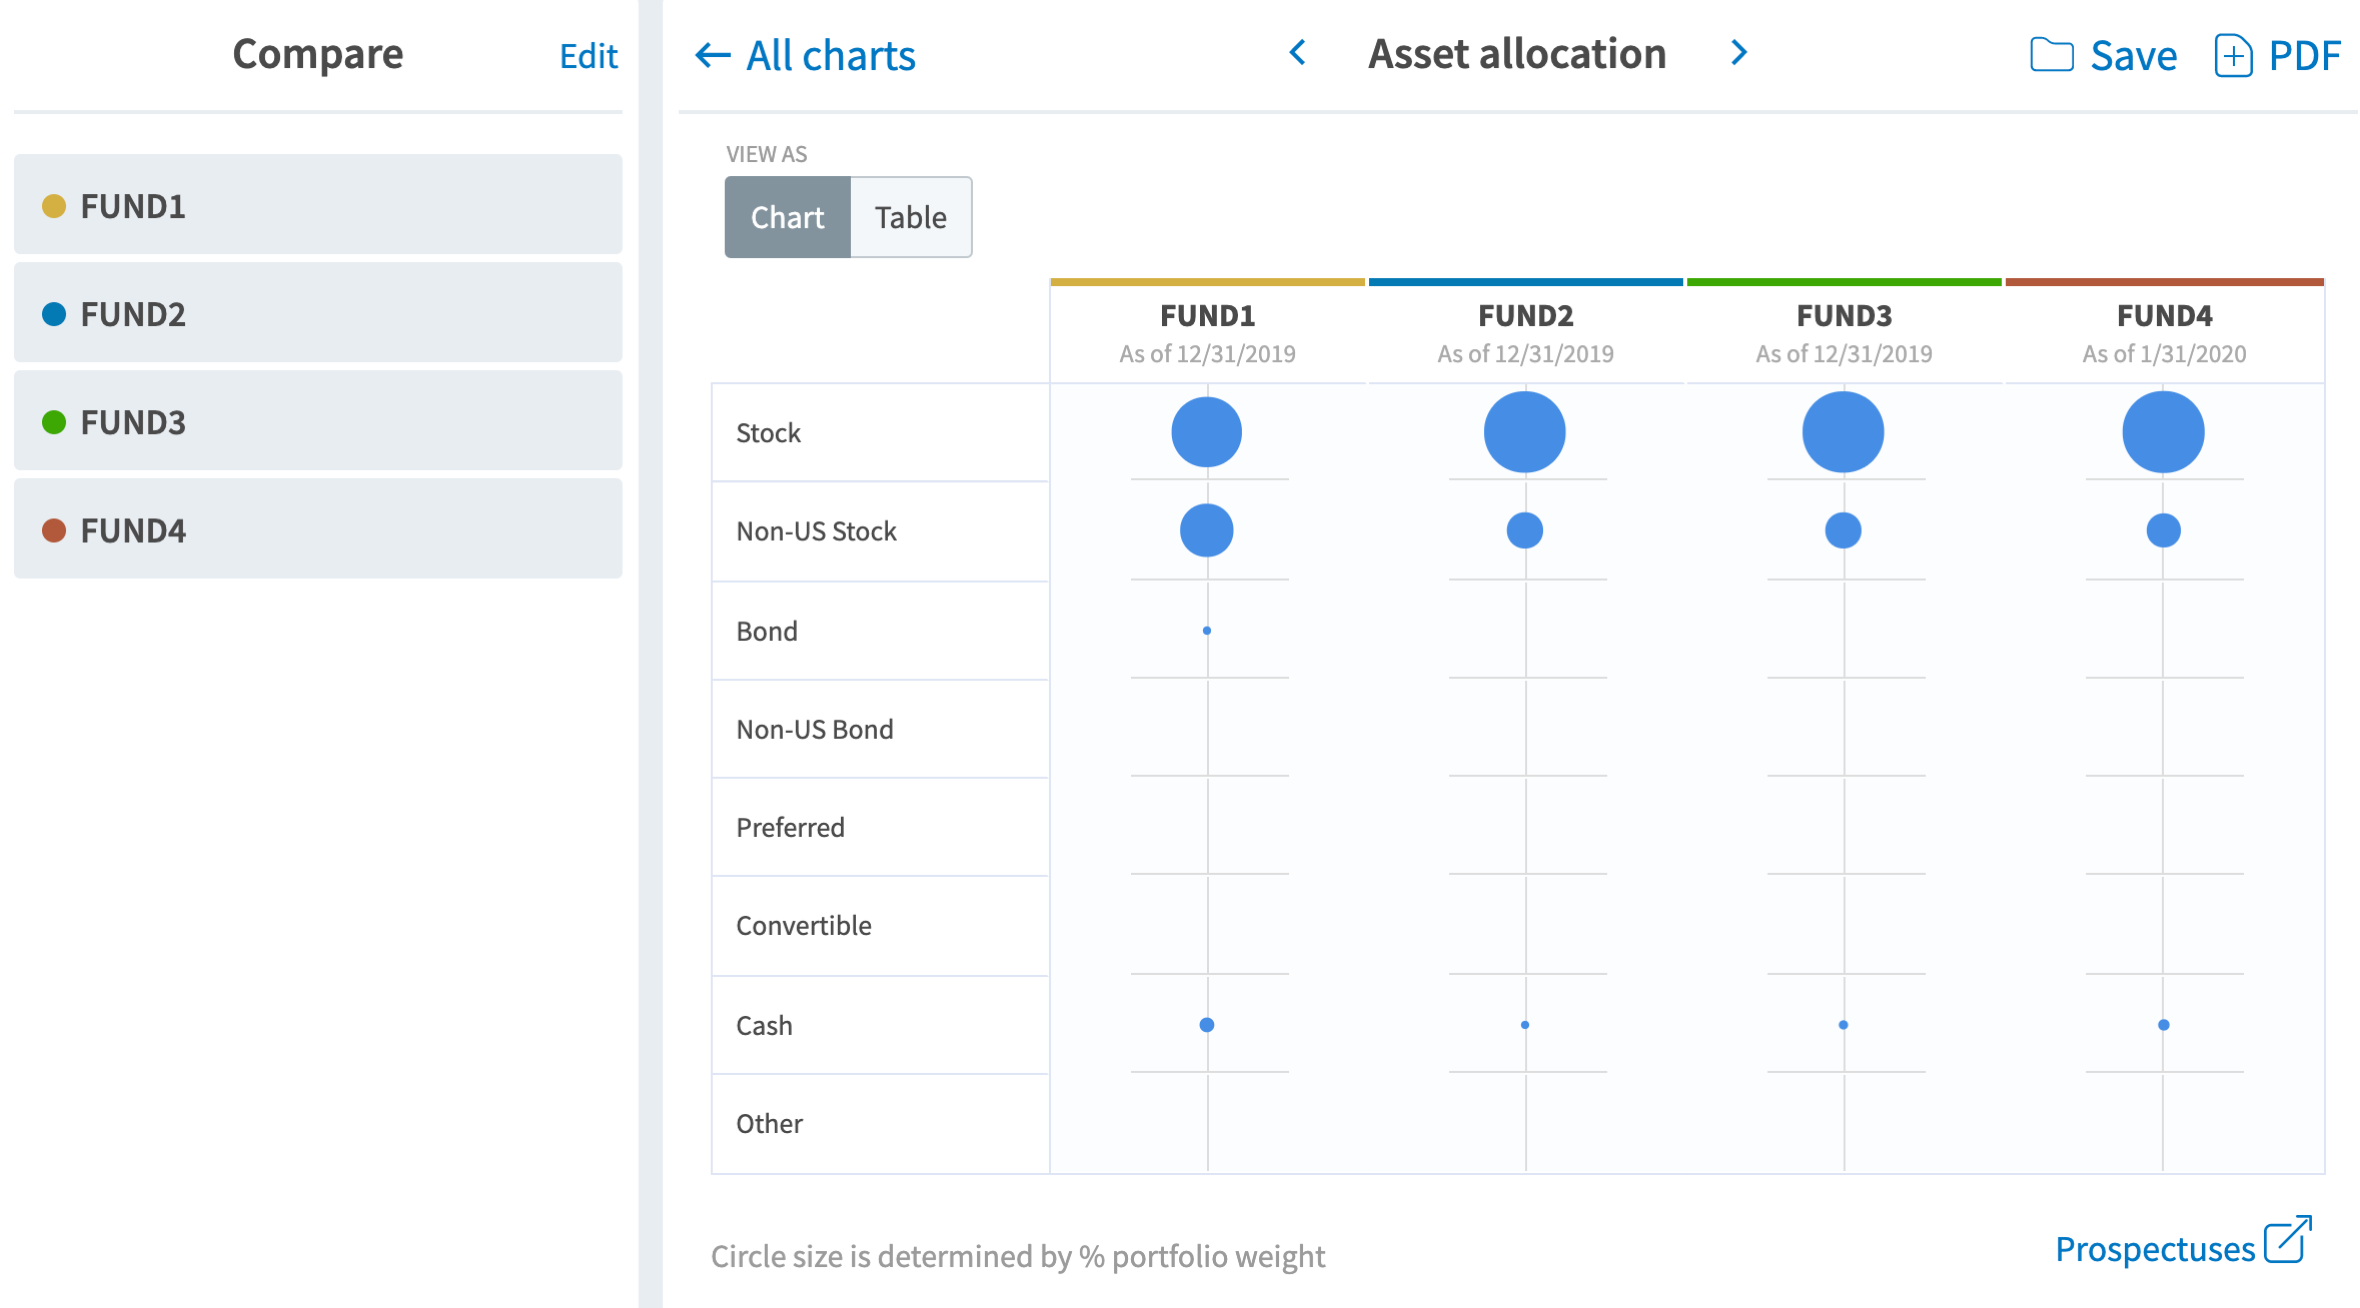
Visualize asset allocation across classes
Create an asset allocation table to illustrate funds’ exposure across different asset classes. The bubble illustration shows where the assets of each fund are positioned in stocks and bonds, non-U.S. markets, convertibles, cash, and other categories.
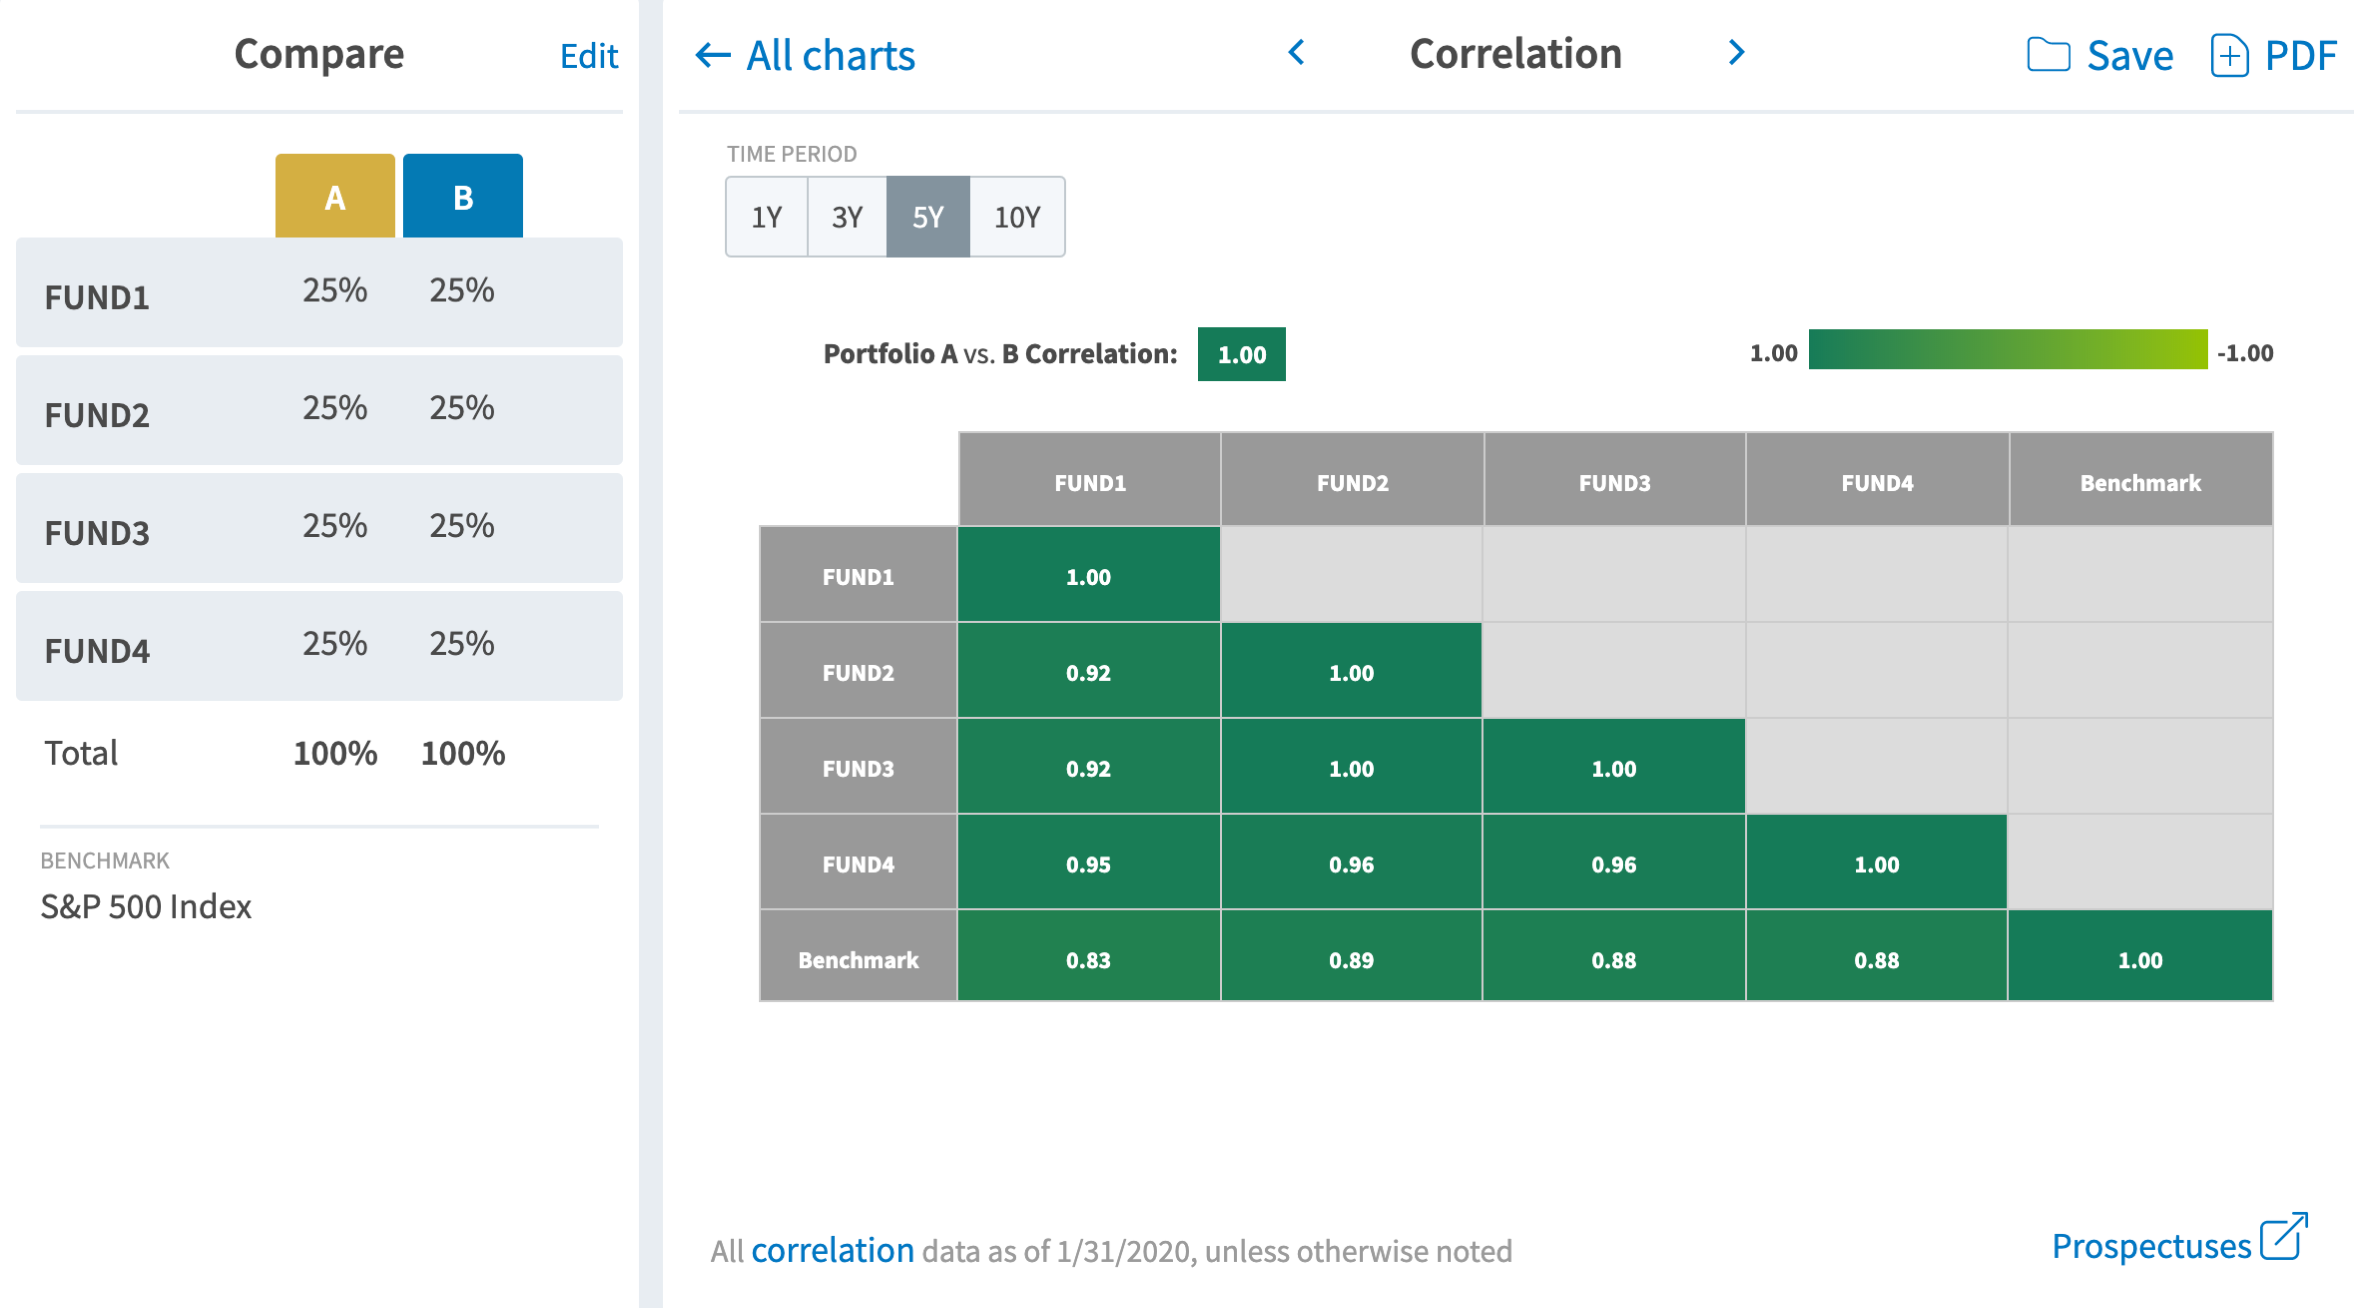
Compare portfolio funds in correlation charts
Build a correlation table to analyze portfolios in greater depth. You will be able to see not only whether the funds are invested in different asset classes, but also if their performance has low or negative correlation. Combining funds with low or negative correlation can help to reduce portfolio volatility.
View historic performance of funds
Create a mountain chart to visualize periods of historic outperformance and underperformance by different funds over time. You may choose to view performance over standard time periods, or use the slider or date range boxes to focus in on a specific period.

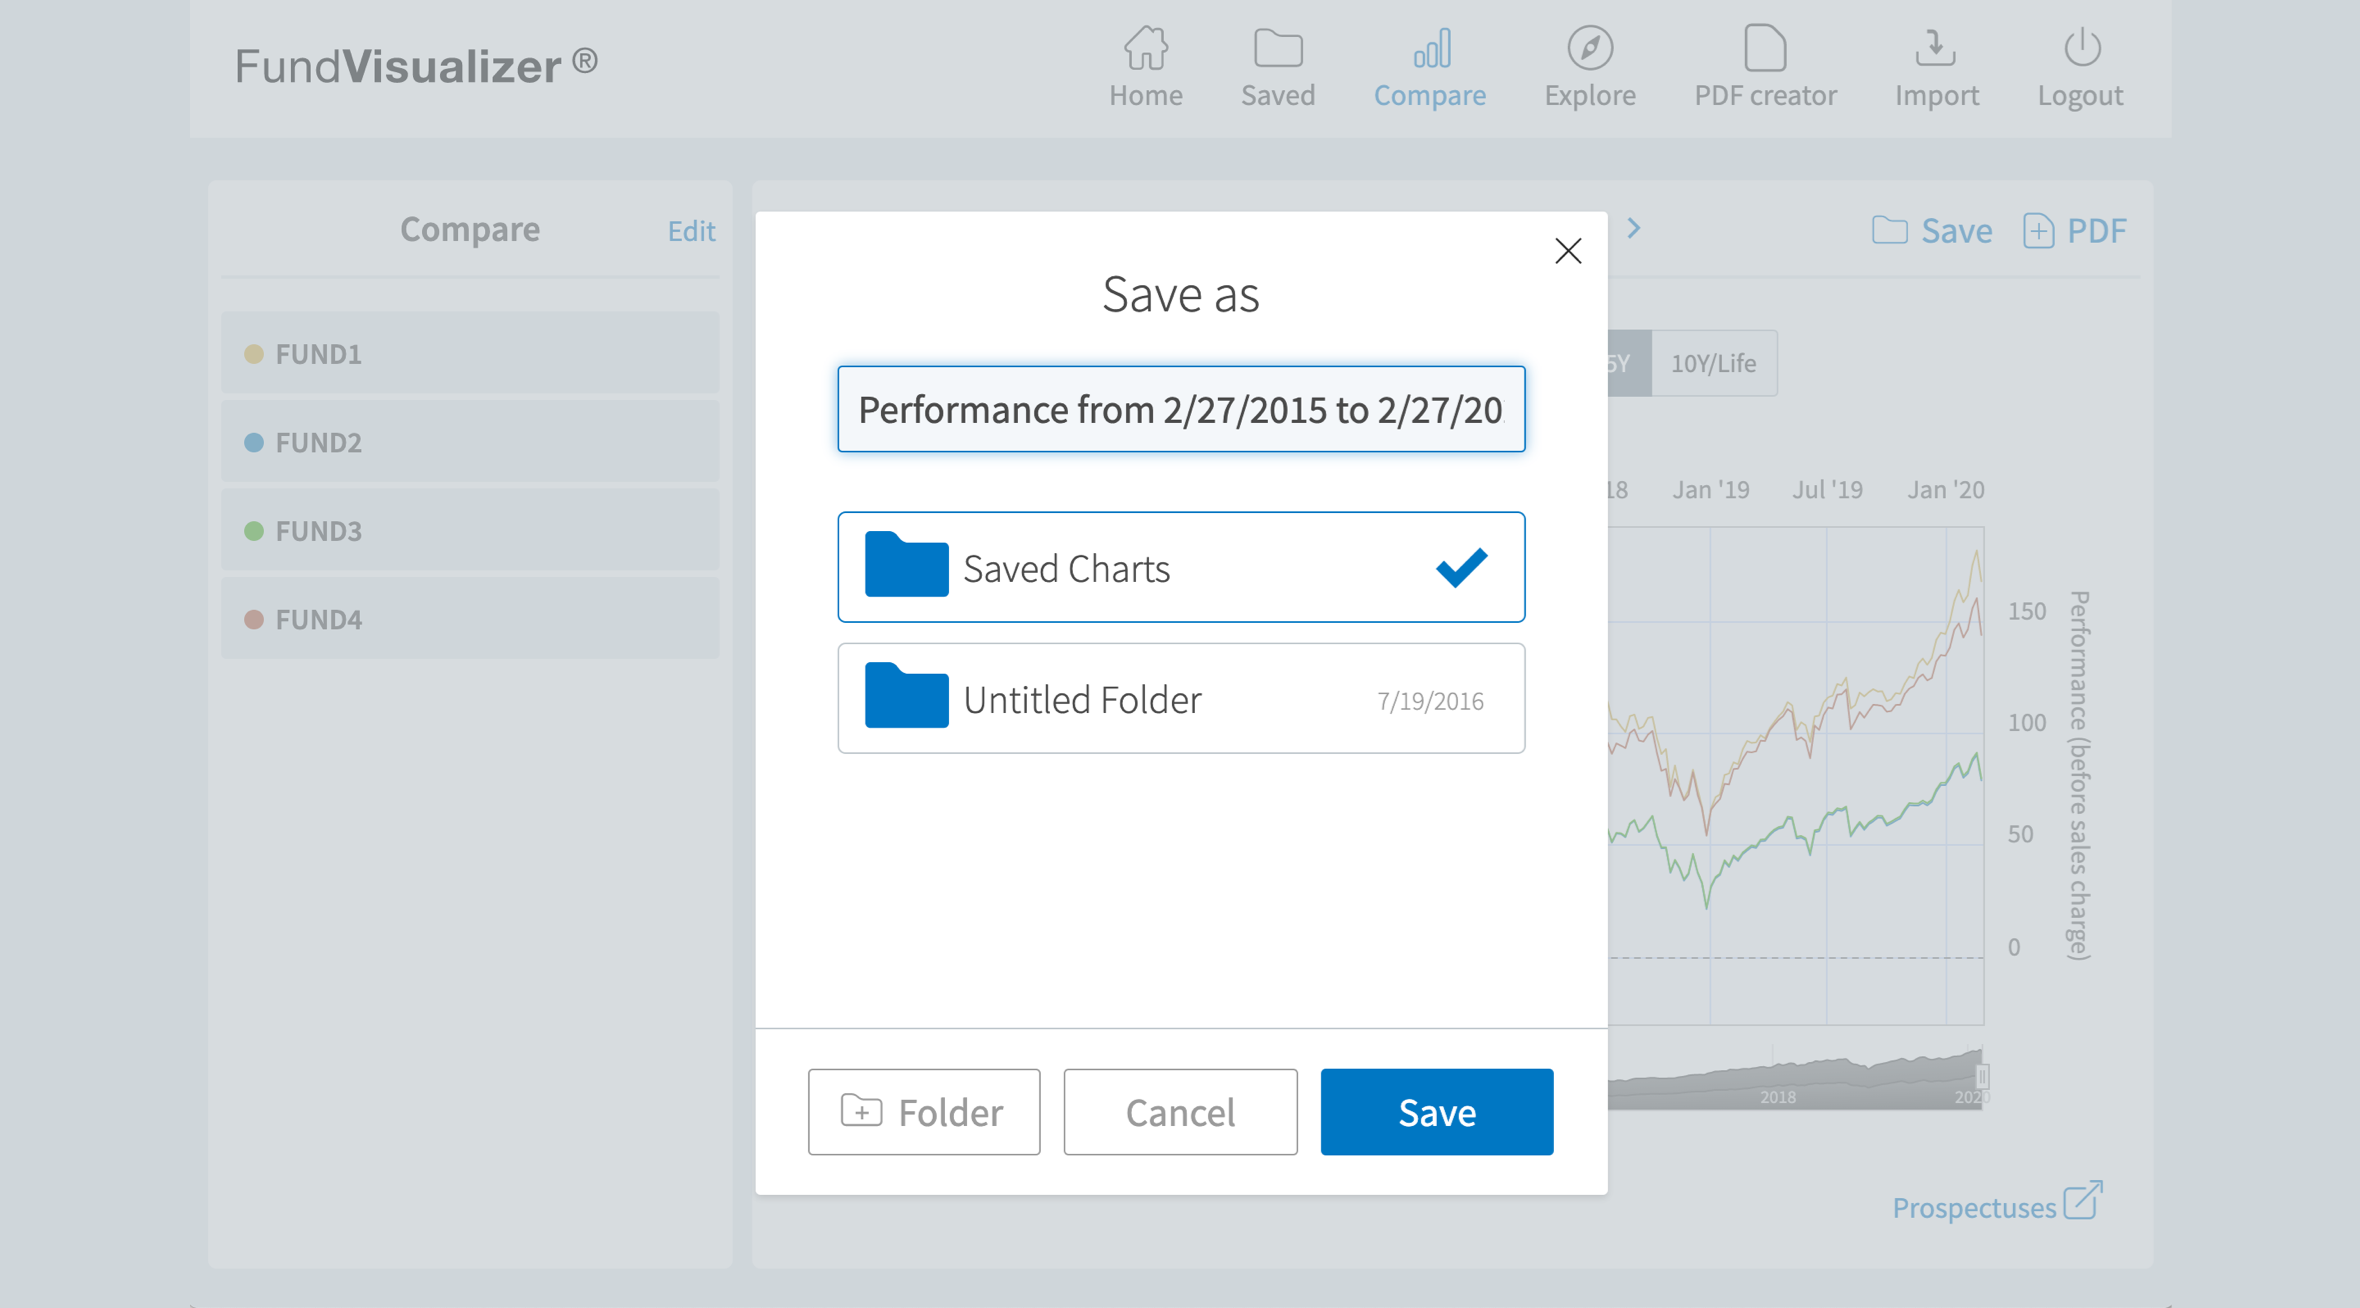
Save charts
All of the portfolios can be saved for future reference and additional analysis.