With the number of exchange-traded funds (ETFs) growing every year, it can be a challenge to find the right choices for investors. FundVisualizer is designed to make it easier for financial advisors to build an ETF comparison.
Over the past 20 years, ETFs have grown from a miniscule investment category to nearly a quarter the size of the mutual fund market. In recent years, ETFs have taken in more assets than traditional mutual funds. The popularity of ETFs rests on a few key advantages including attractive expense levels, transparent portfolio construction, and a consistent investment style over time.
Build comparisons to see which ETFs are most competitive
Most ETFs feature passive portfolio construction. They are built to match indexes and charge lower management expenses than traditional mutual funds. However, not all ETFs have the same expense levels.
With FundVisualizer, you can easily compare expense ratios to see which ETFs are most competitive.
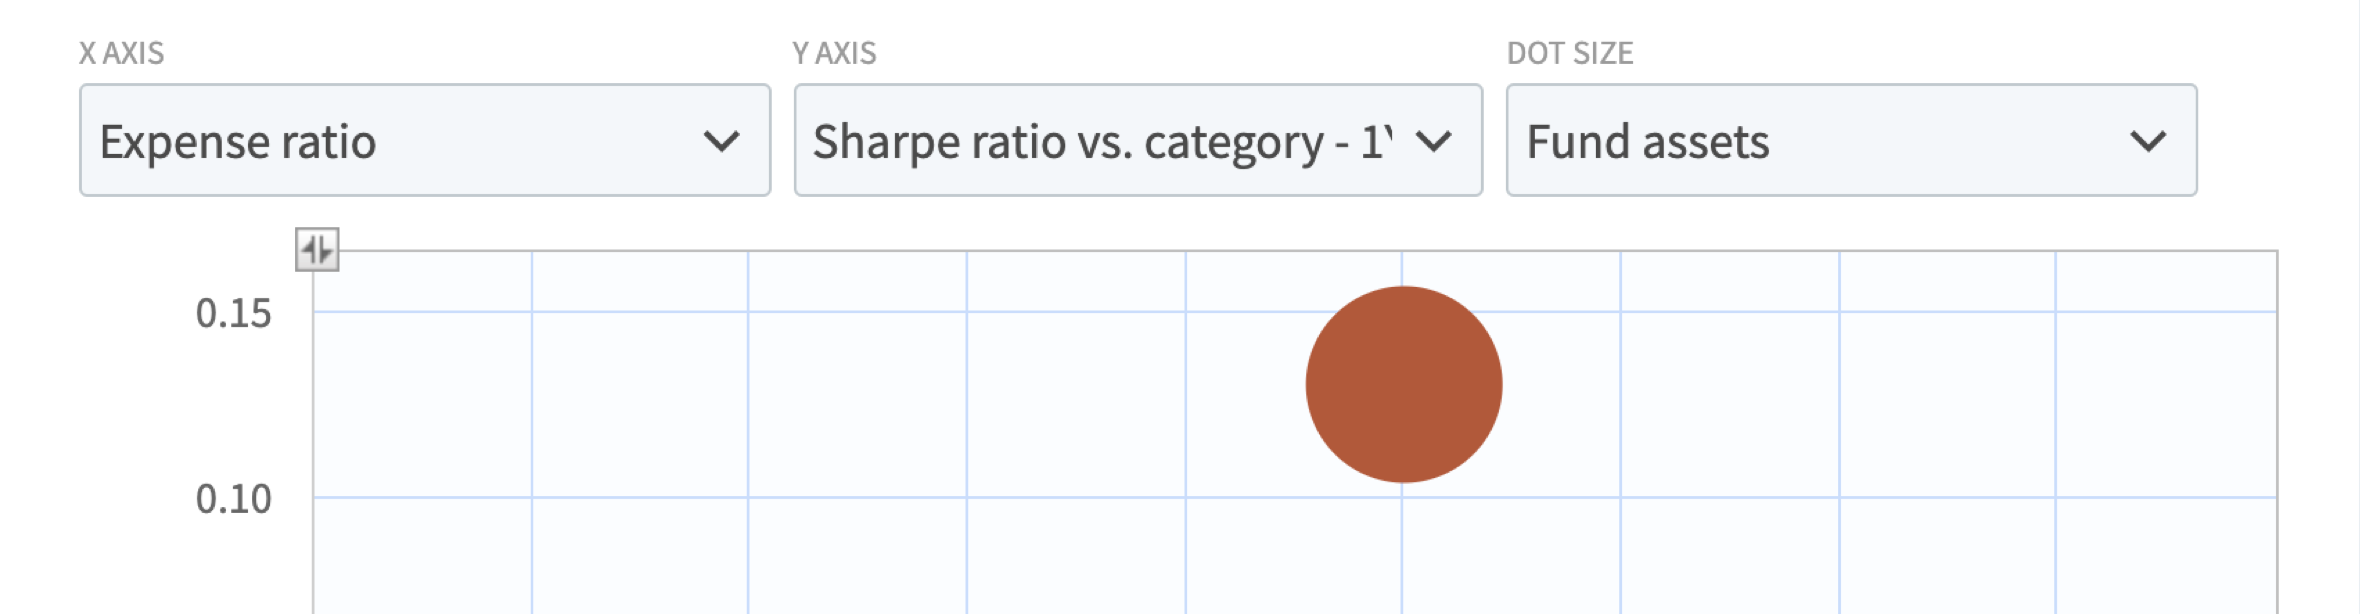
An ETF designed to track an index should have a high correlation coefficient (R-squared) and a high information ratio. You can compare these ratios and others for ETFs using FundVisualizer.
In the comparison below, you can build an ETF comparison with one ETF and three index funds that track the S&P 500 Index. They have matching R-squared values of 100, but different information ratios and expense ratios.

Combine ETFs in a portfolio
Advisors who favor ETFs broadly can use FundVisualizer to research how to combine ETFs in a portfolio.
From the FundVisualizer home page, use Compare or Import to add ETFs for comparison.
Compare enables you to enter ETF names or tickers. Import enables you to copy and paste or upload a spreadsheet with your list of ETFs.
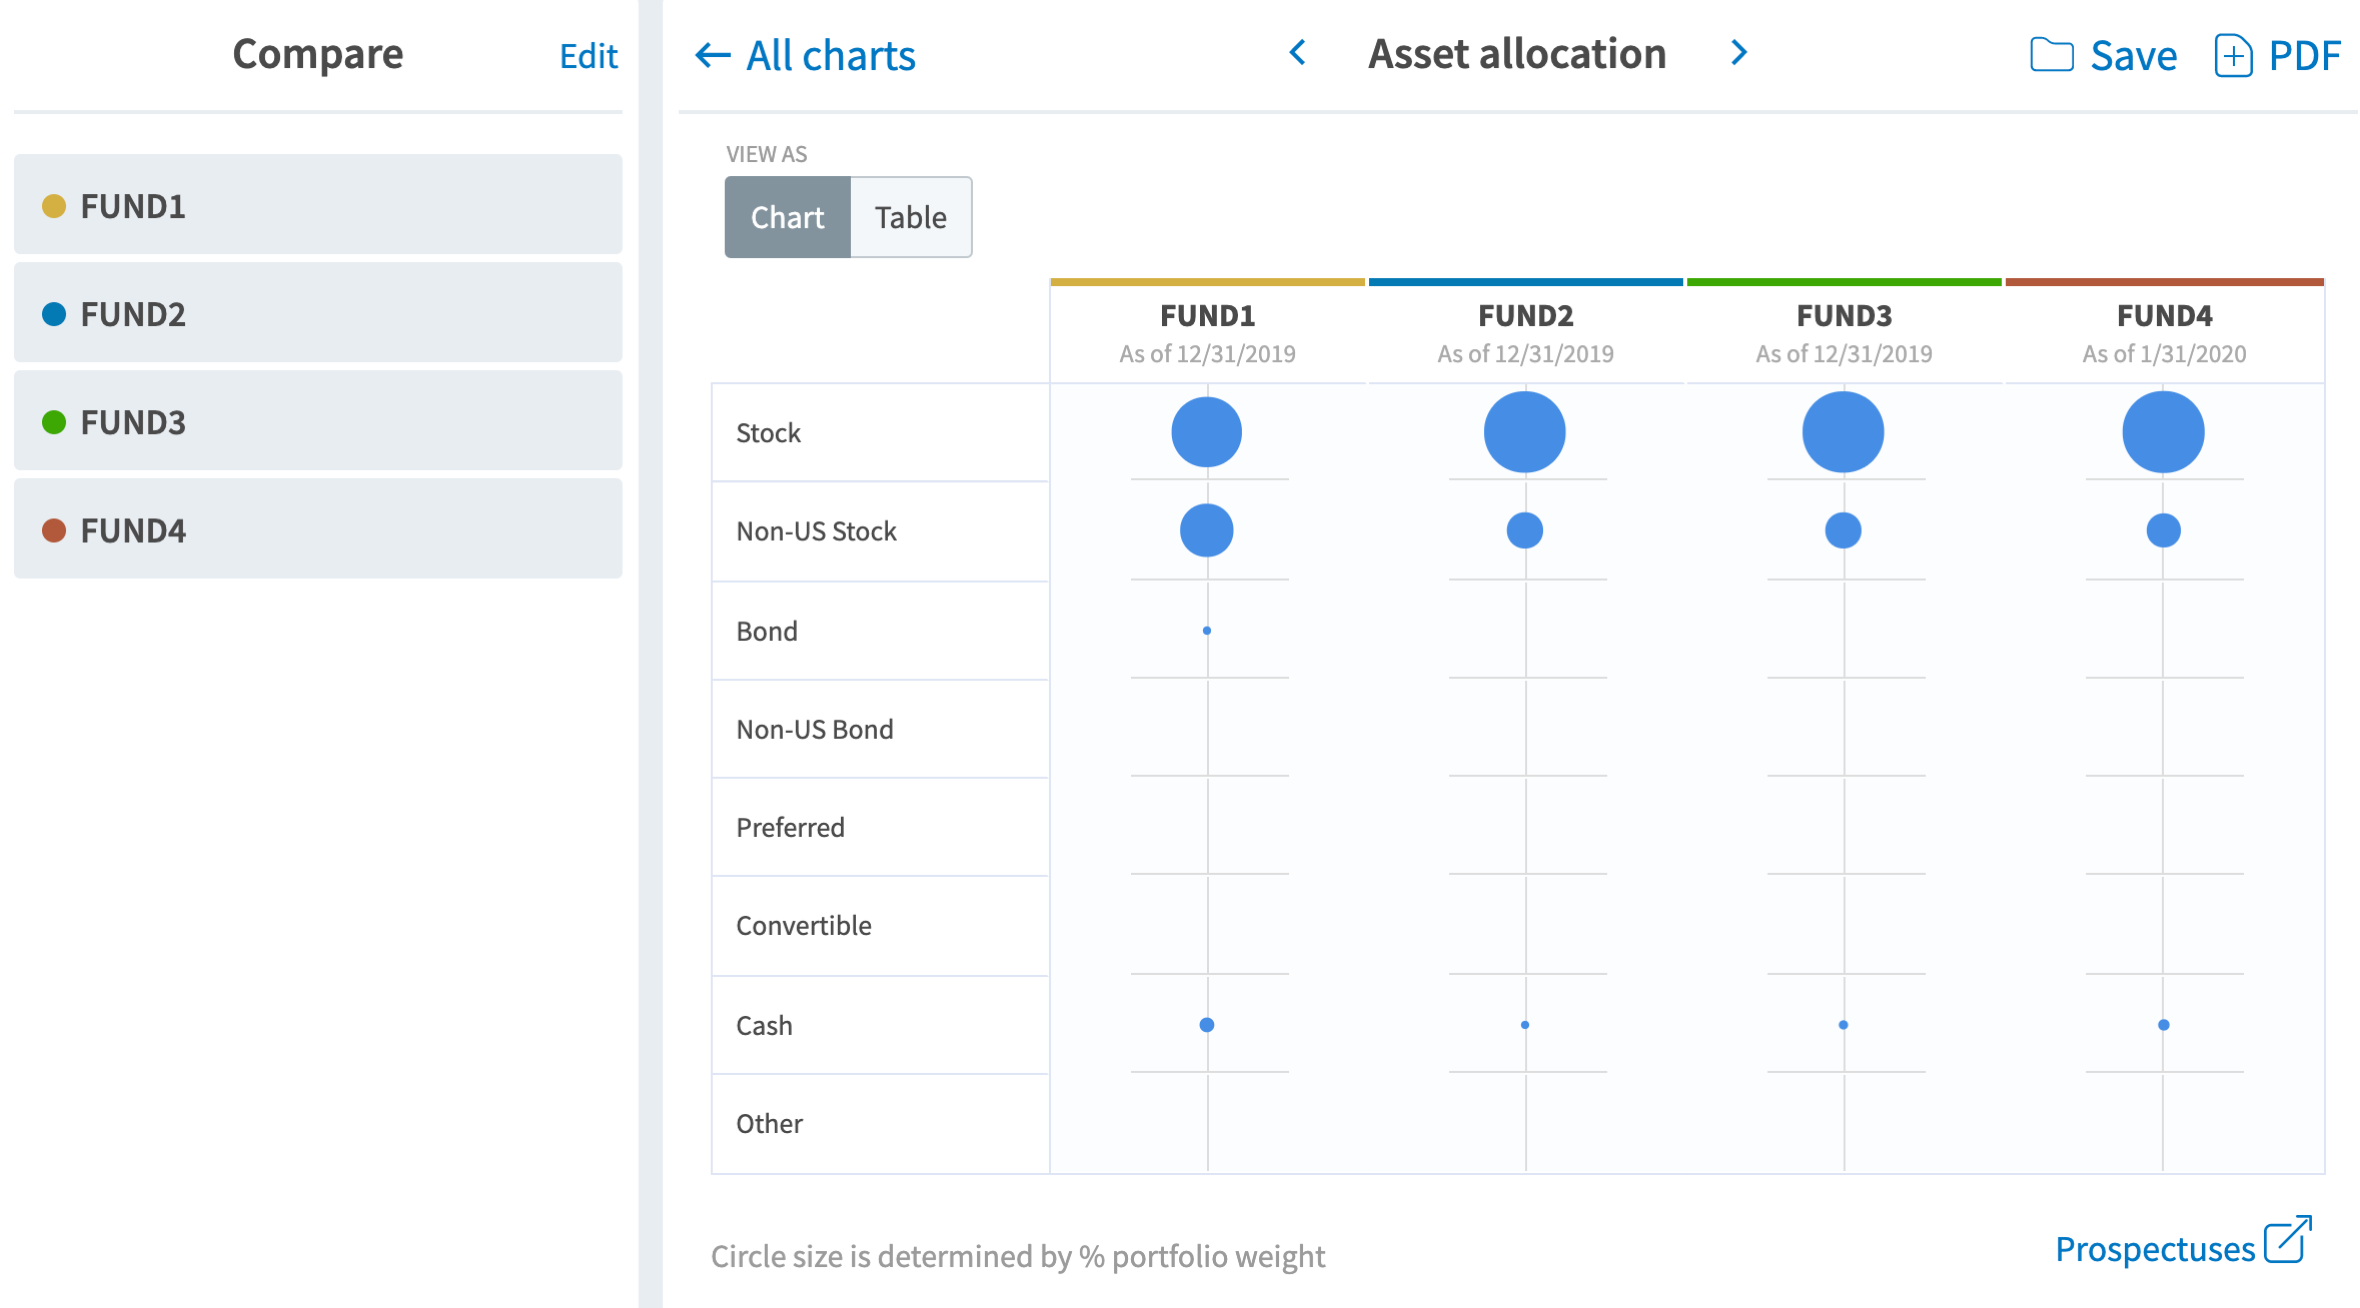
From there, you can create an ETF comparison by asset class to find opportunities for building diversified exposures.
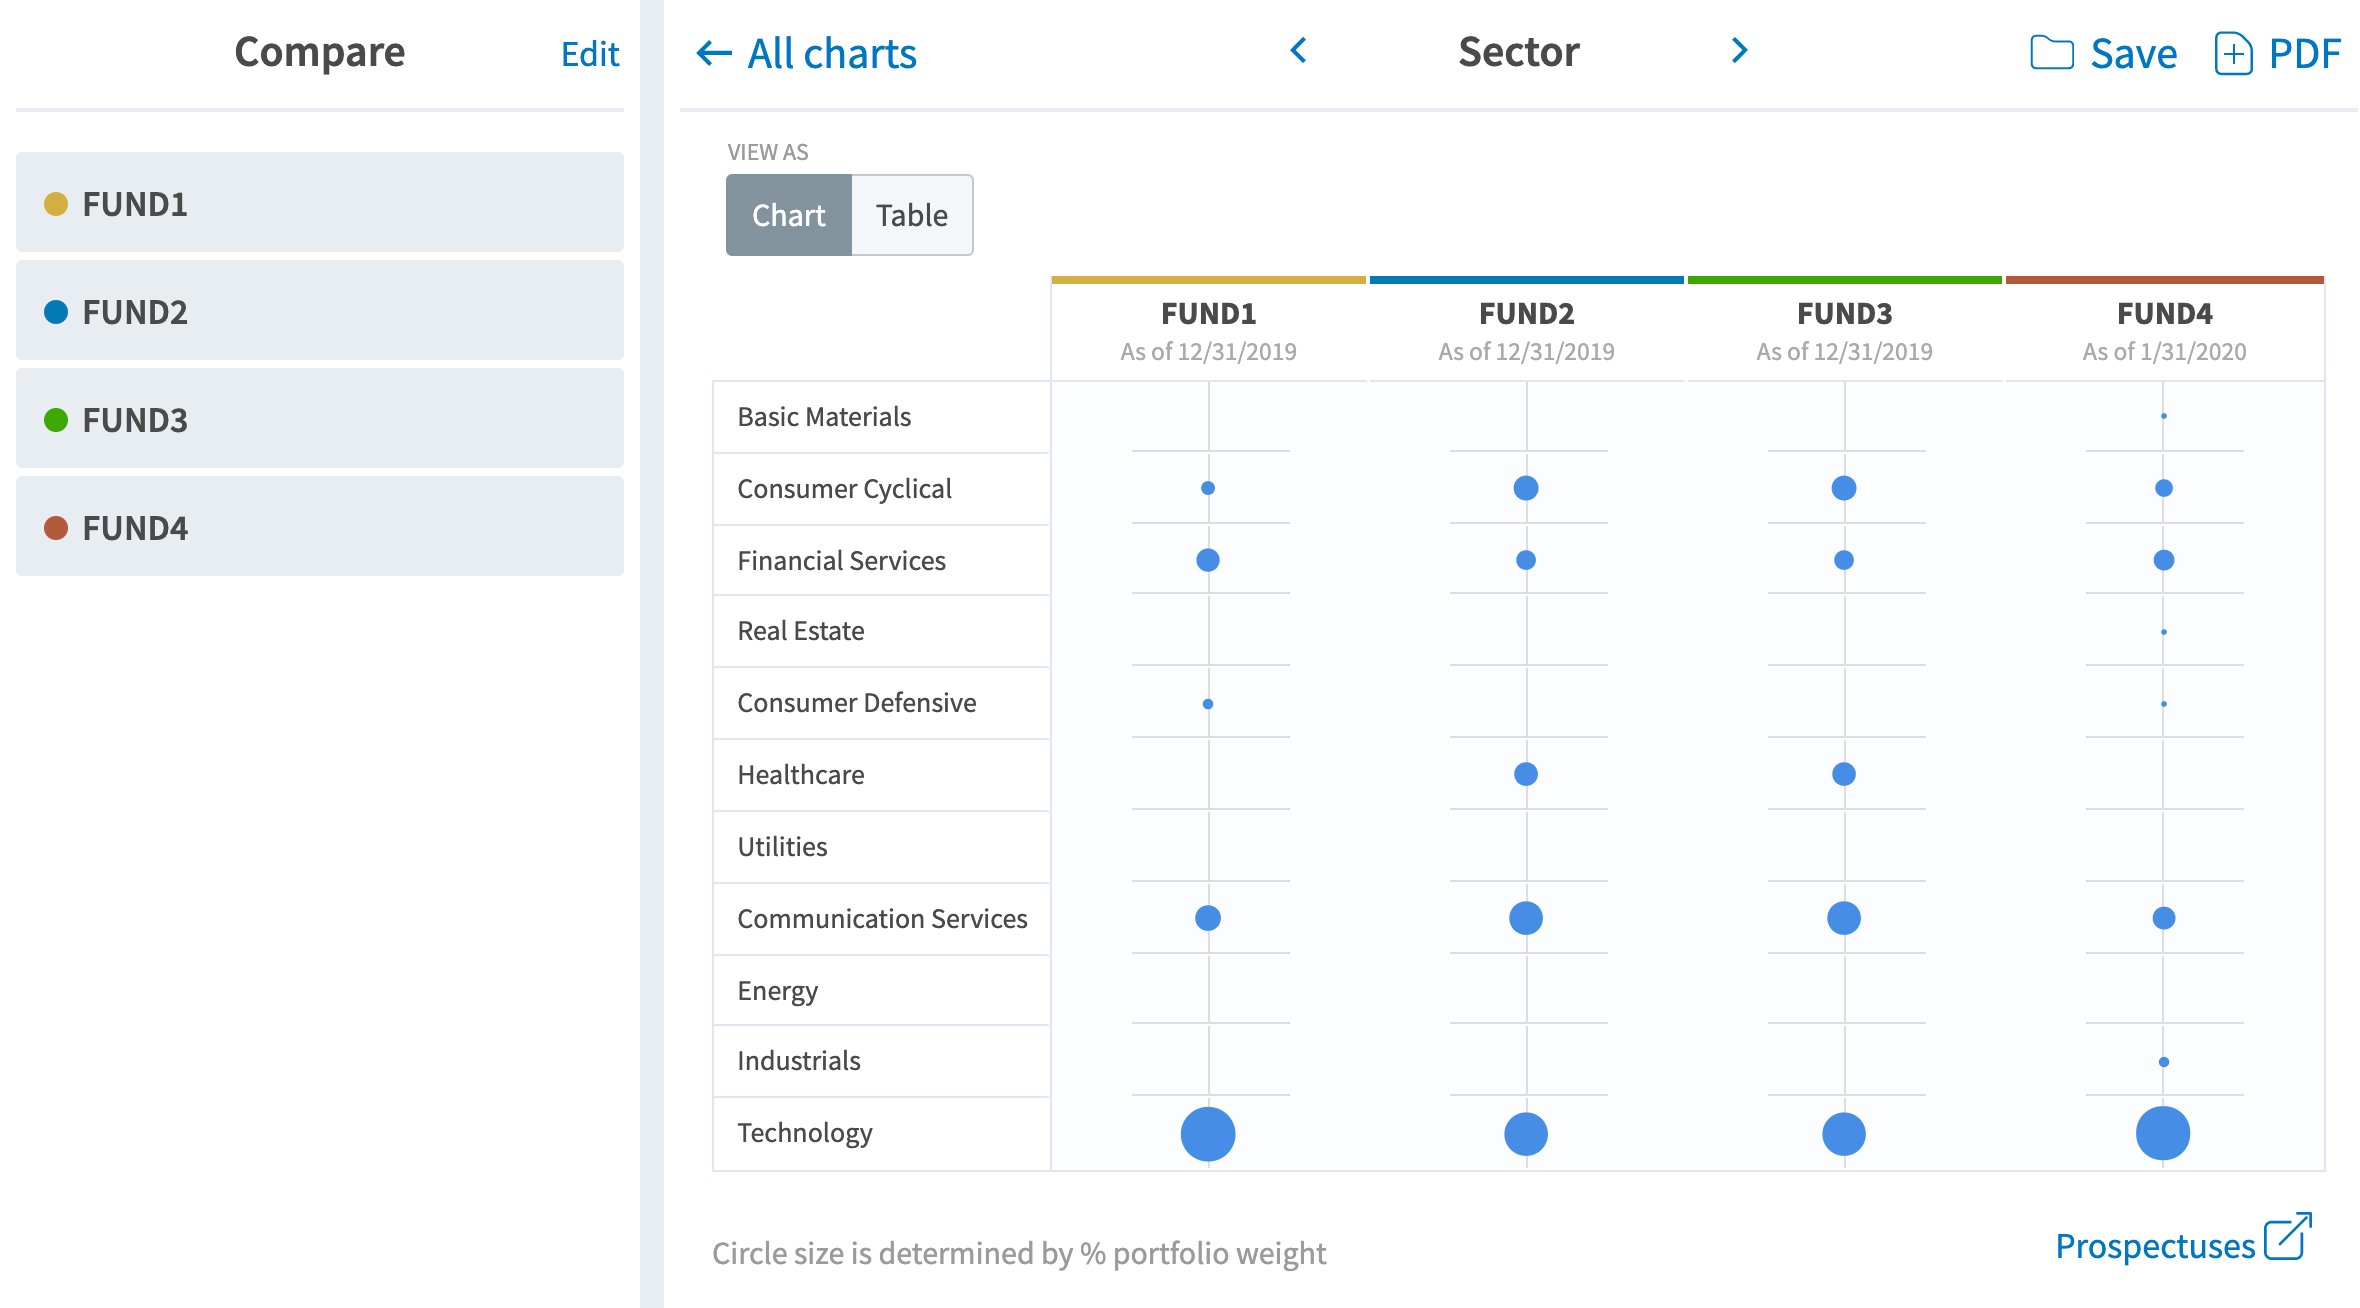
For portfolios with multiple ETFs within one asset class, such as equities, it is helpful to compare sector weightings for another level of diversification.
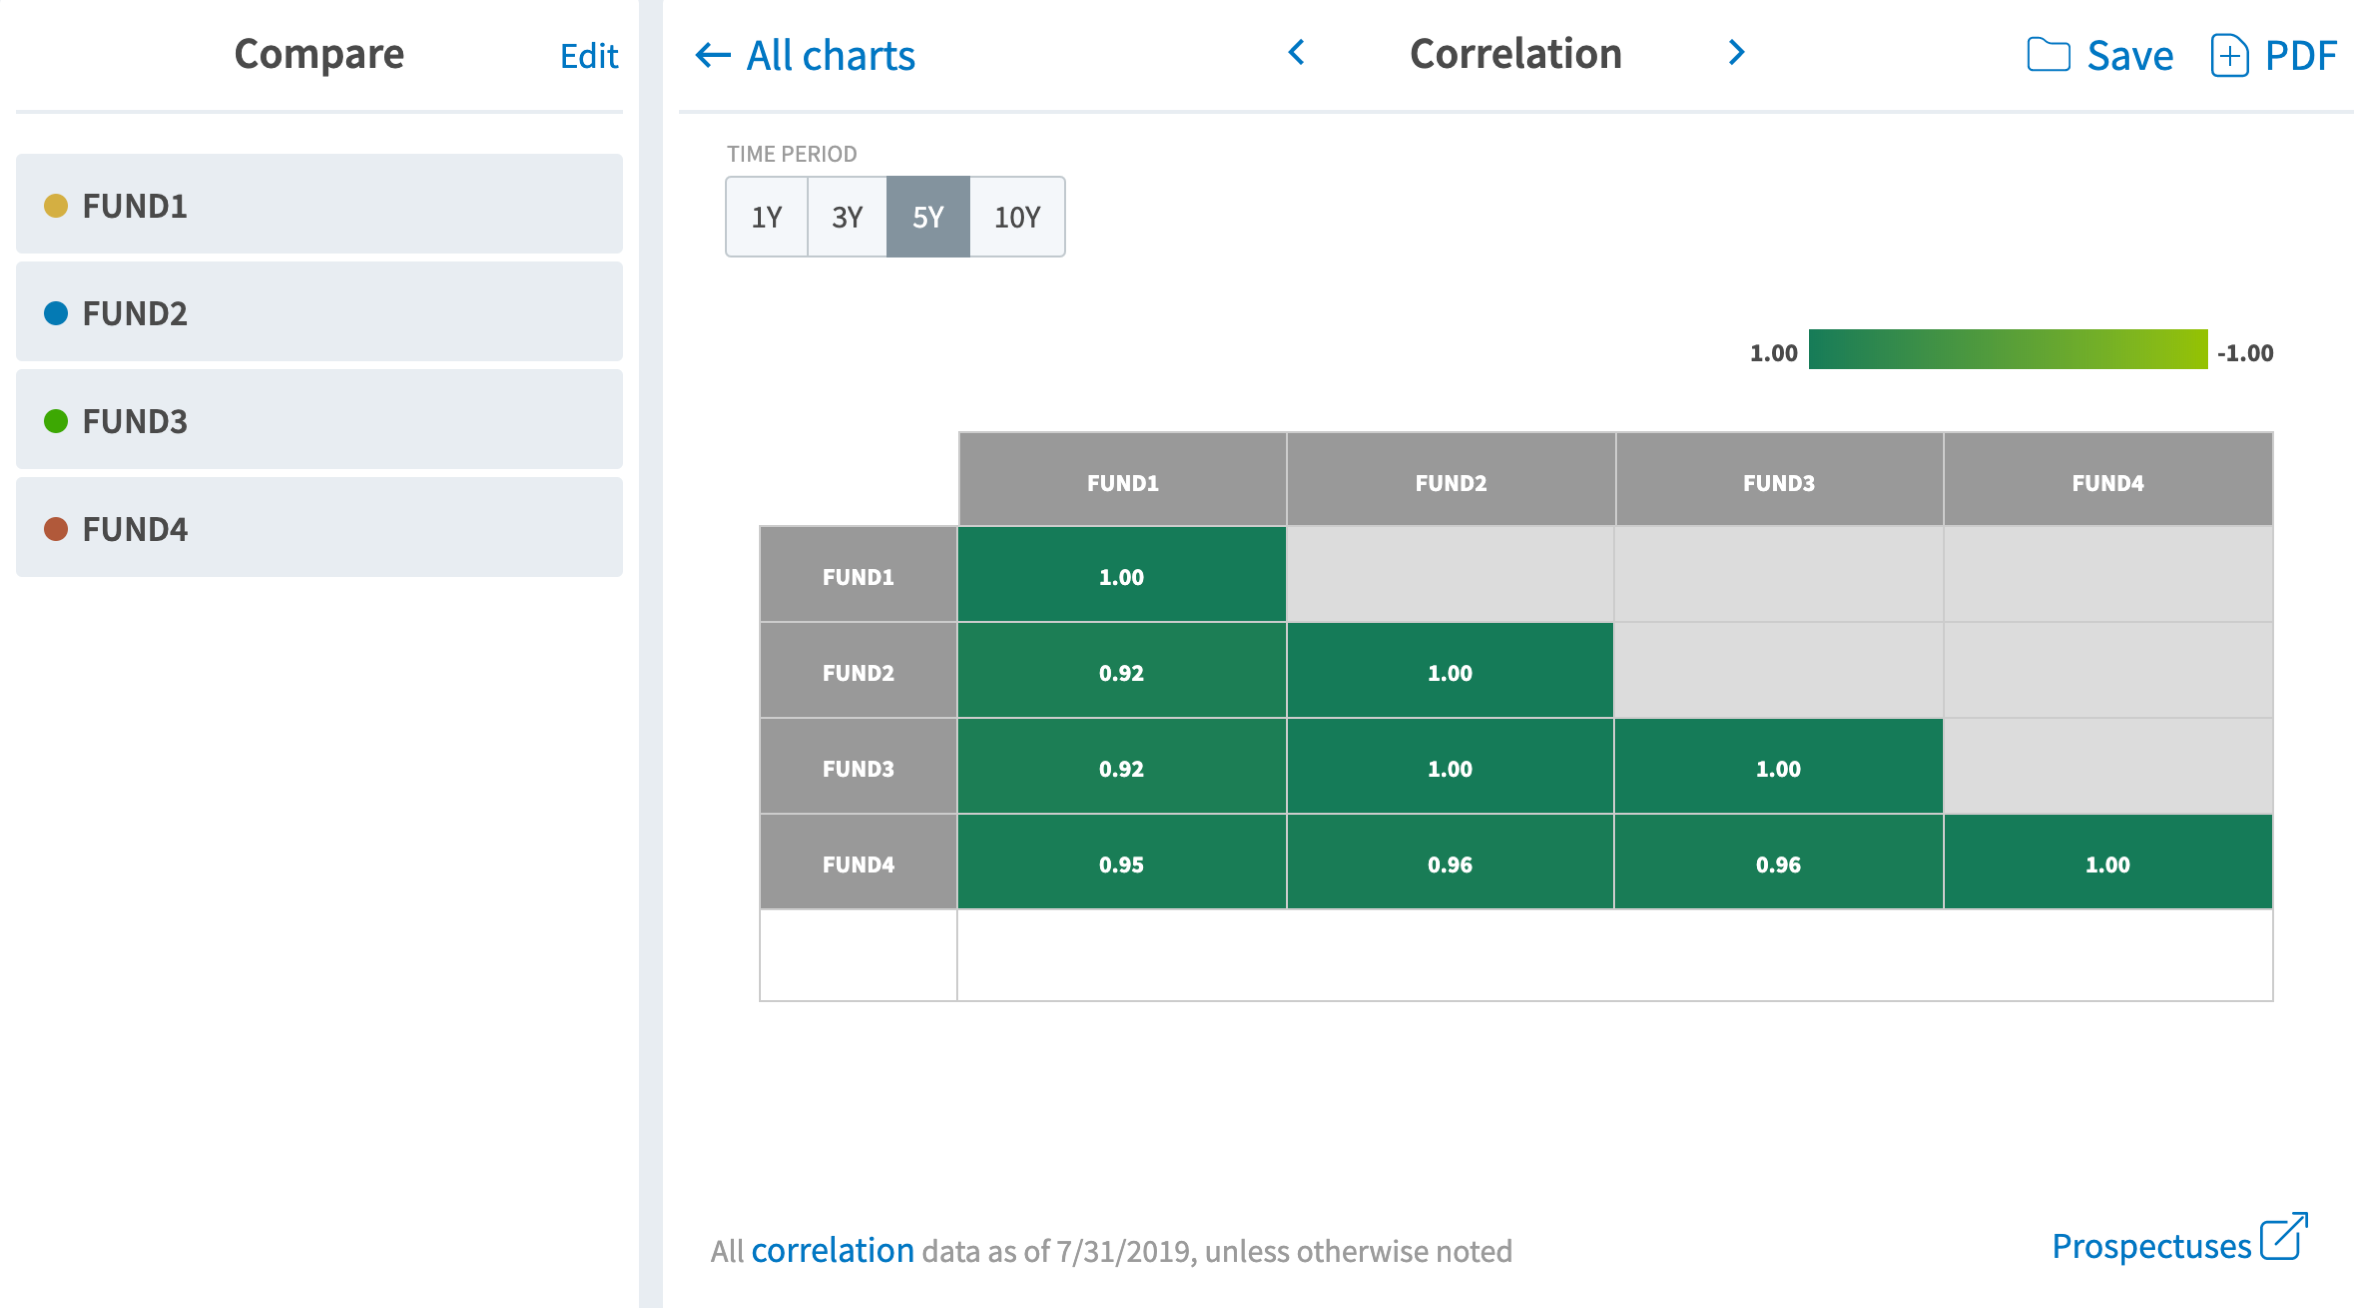
FundVisualizer also makes it easier to build ETF comparisons in a correlation table. Combining ETFs with low or negative correlations can help to reduce overall portfolio volatility.